Chapter 6: Using OrionNET Software
Argus TubeSpec User Guide NOV CTES 65
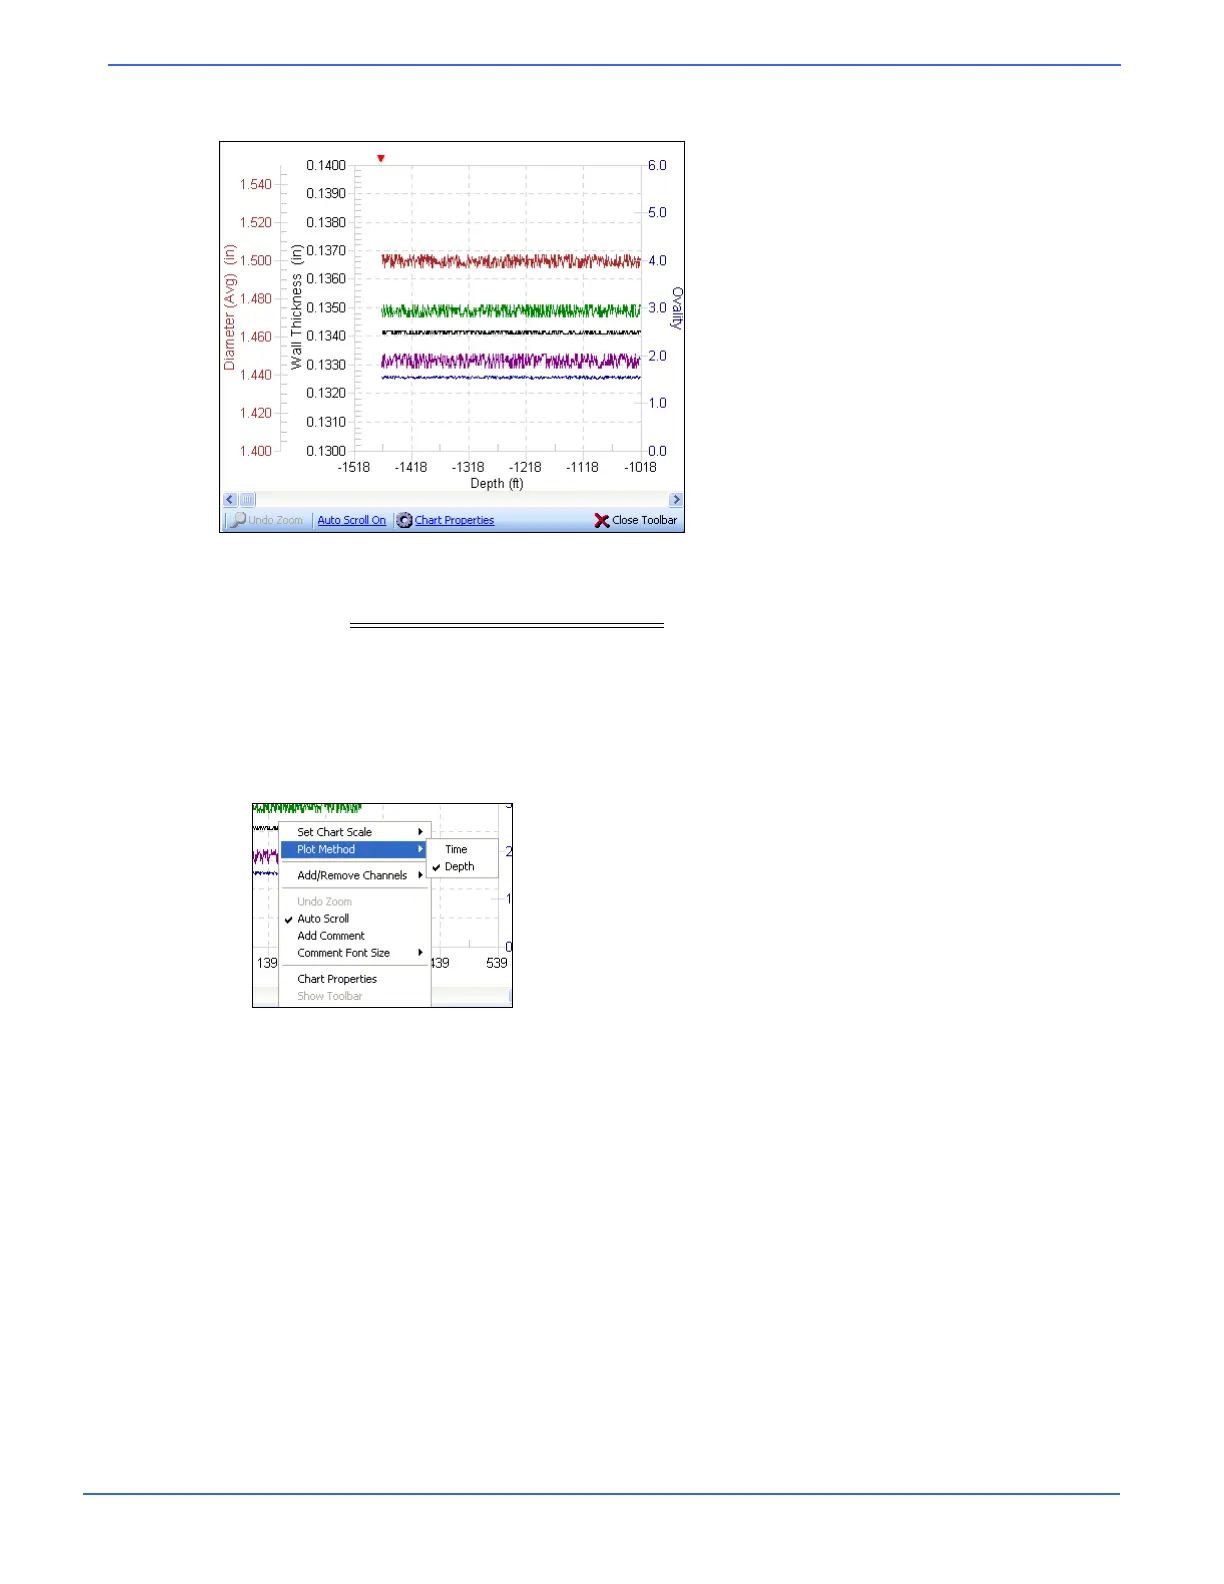
The diameter plots in brown; and the minimum wall thickness, average wall thickness, and maximum
wall thickness in purple, black, and green, respectively.
The chart supports plotting by either time (default) or depth (if an OrionNET CT Depth channel is
available – see Updating the Default Configuration
to include a CT Depth channel). Plotting by depth
is an excellent way to observe measurements over the entire length of the tubing.
To select a plotting method (time or depth)
1. Access the chart menu by right-clicking anywhere on the chart surface.
A checkmark appears beside the current plotting method.
2. Select Plot Method > Time or Plot Method > Depth on the chart menu.
The user defines the time-period of the display of data (the chart scale) using the same methodology.
To define the data-display time period (set chart scale)
1. Access the chart menu by right-clicking anywhere on the chart surface.
2. Select Set Chart Scale.