Chapter 6: Using OrionNET Software
Argus TubeSpec User Guide NOV CTES 67
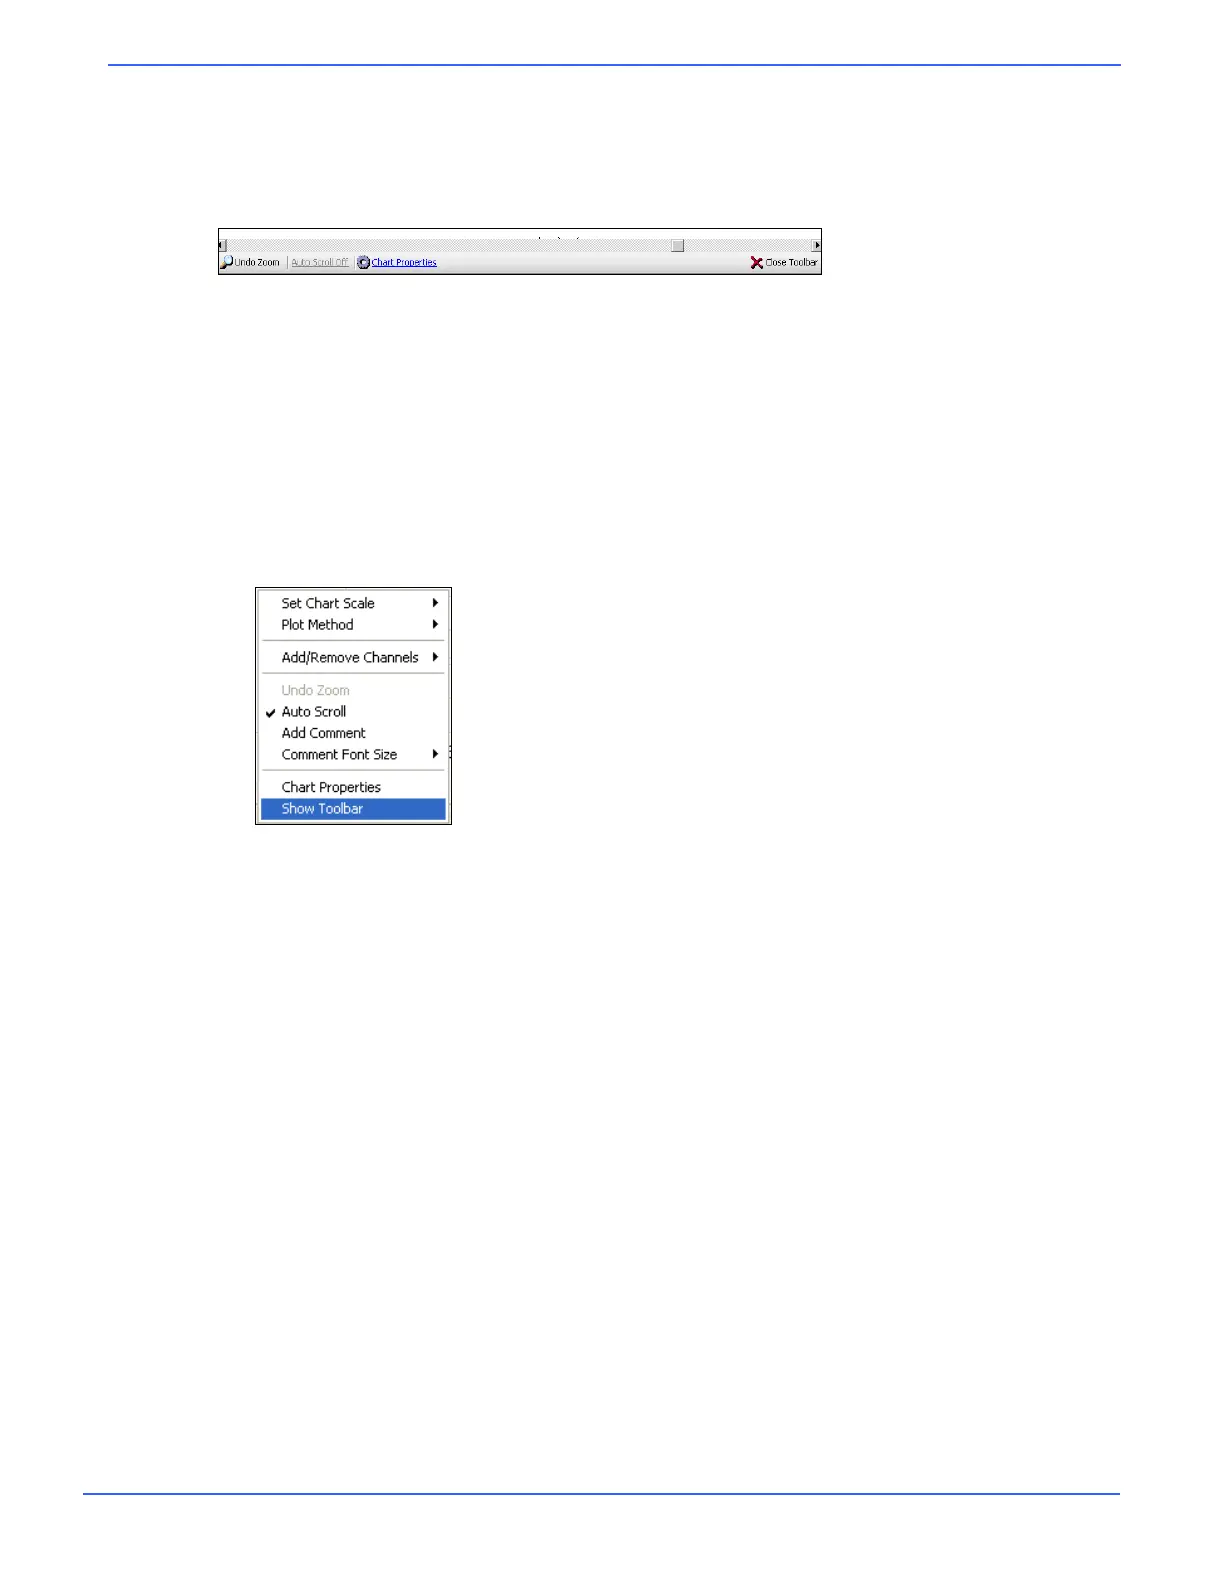
Using the Chart Toolbar
The chart toolbar, residing along the bottom of the chart-plotting area, provides easy access for com-
monly used chart functions. It also provides a graphical indicator of the state of the zoom and auto-
scroll chart functionalities.
To use the chart toolbar
1. Select Undo Zoom to restore all areas of the chart view to normal plotting after zooming-in on a
chart region or area.
2. Select Auto Scroll Off to disable automatic scrolling, as when reviewing past data without zoom-
ing. Select Auto Scroll On to keep the current data-point visible in the viewing area.
Select Close Toolbar to hide the toolbar. To reactivate an invisible toolbar, right-click anywhere on the
chart-plotting surface and select Show Toolbar.
Reviewing Data
Zooming In and Out on the Chart-plotting Area
The user may zoom in on a particular region of the chart-plotting area [within the chart view] when
reviewing data recorded by the TubeSpec system.
To zoom in on a specific region of the chart-plotting area
1. Click and drag the mouse over a region of the chart-plotting area.
2. Release the mouse button; the chart zooms in on the specified region.
To undo the zoom
1. Right-click anywhere on the chart surface.
2. Select Undo Zoom.
OR