Chapter 6: Using OrionNET Software
Argus TubeSpec User Guide NOV CTES 75
The word “Weld” appears in the sensor-channel column of the sensor that detects the weld.
If one of the proximity probes is not working, no Value appears in its related spreadsheet cell.
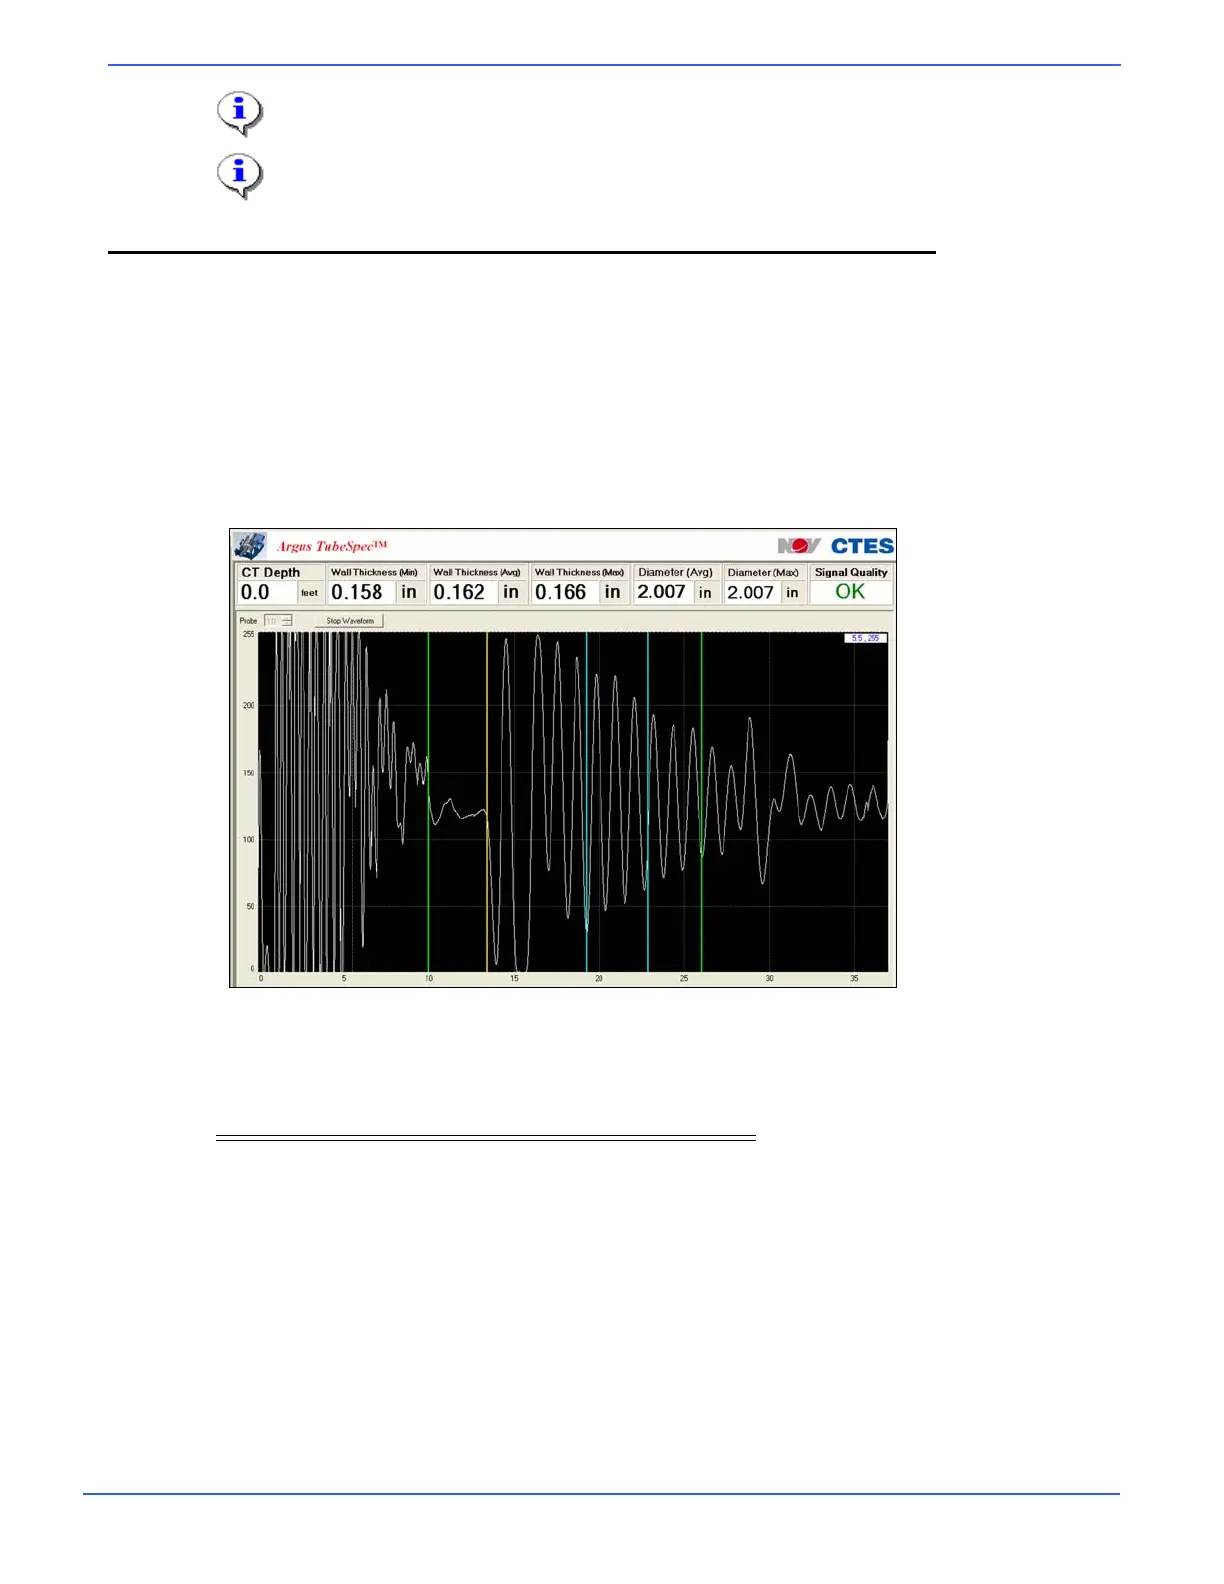
Using the TubeSpec Waveform View
The Argus TubeSpec waveform view design displays a plot of waveform vs. time in relation to a spe-
cific probe/UT sensor number.
The horizontal axis displays time in microseconds; the vertical axis displays waveform amplitude val-
ues from 0 - 255.
The cursor position is shown as the crosshair intersection on the waveform plot. Cursor values are dis-
played un the upper right-hand corner of the plotting area.
The following gate controls are displayed as vertical lines on the waveform plot:
Vertical Line
Color Index
Yellow Urethane-steel UT interface
Cyan Where the steel resonance search begins
and ends
Green Where the urethane search begins and
ends