Graphics Display
SMART MATRIX WINDINGFEEDER - 32 -
Graphics Display
This function, which can be activated pressing the button, allows you to selectively display two types
of graphical information on Smart Matrix screen.
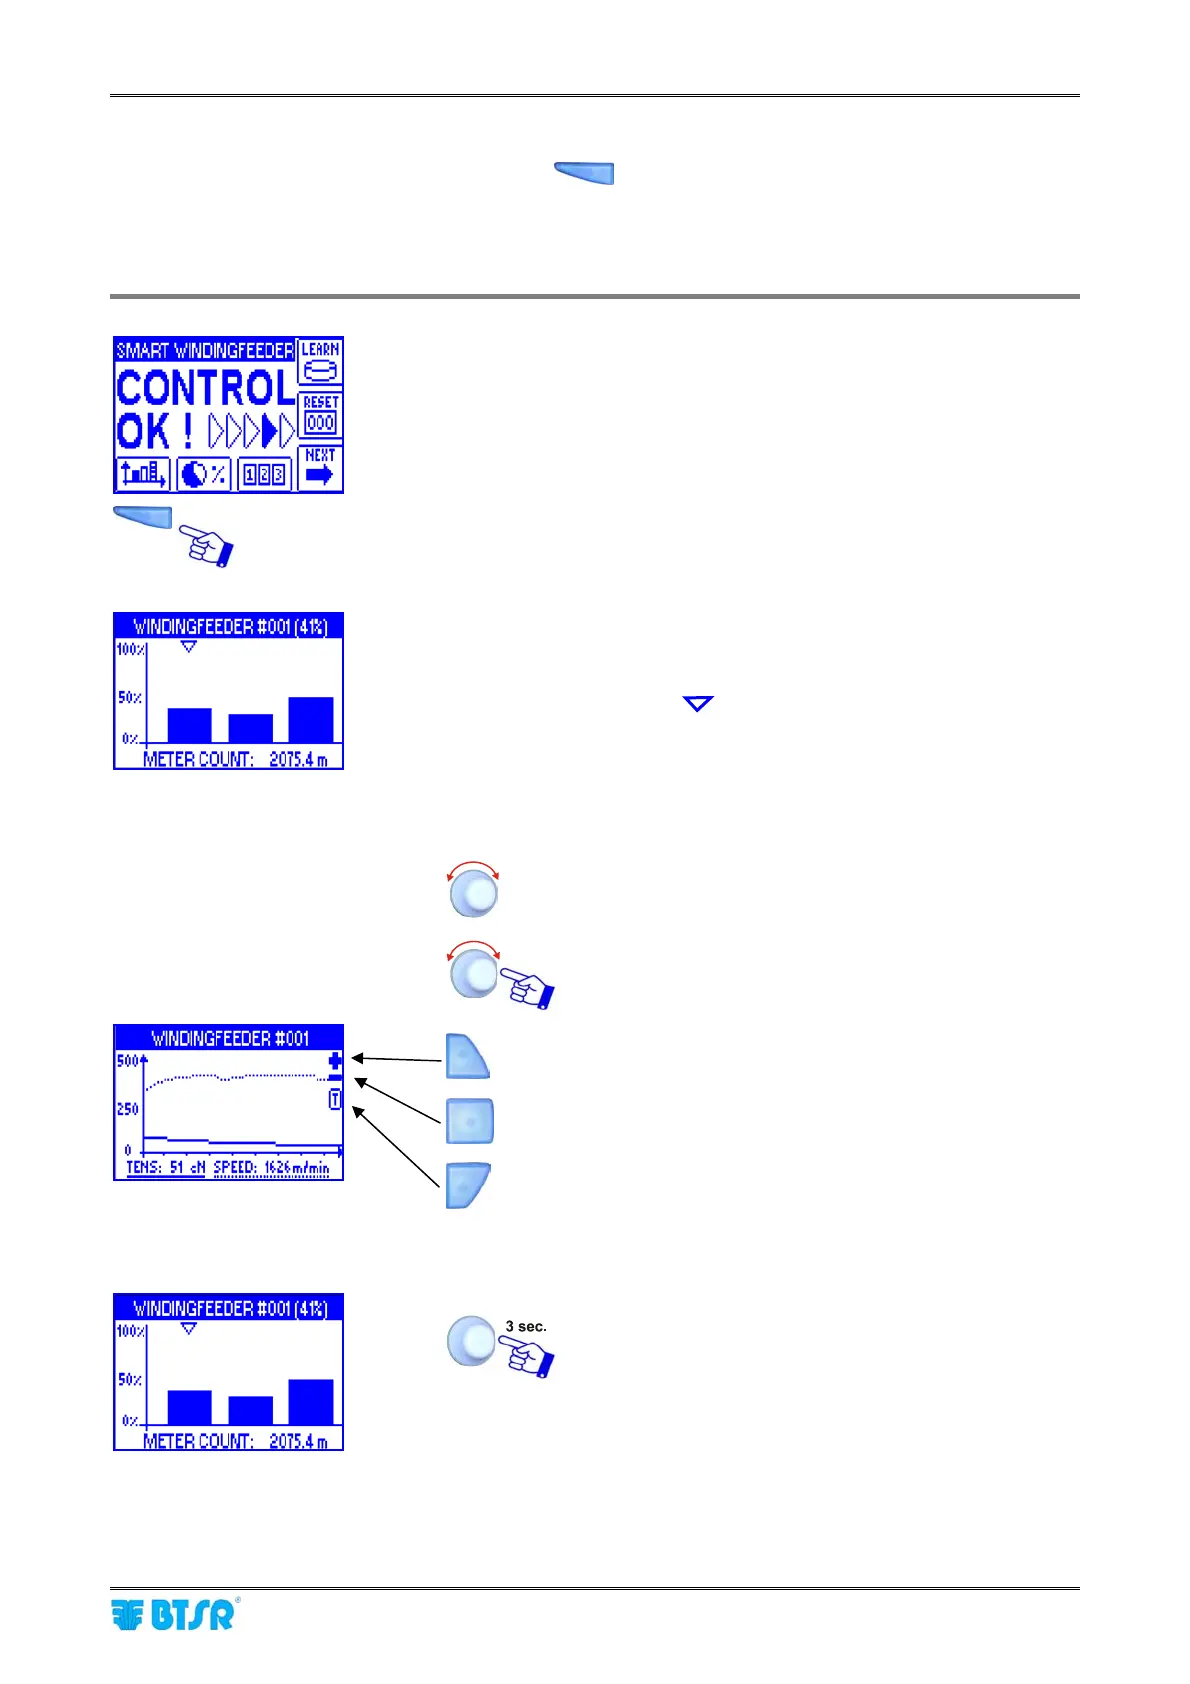
1) Histogram indicating the amount of yarn fed by each WINDINGFEEDER device.
2) Dynamic display of feeding tension (in cN) and speed (in m/min) curves.
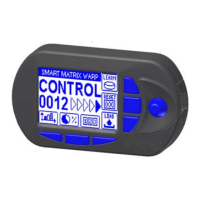
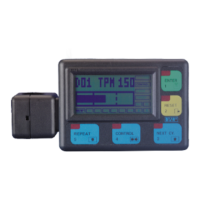
Hystogram display
Press the button which allows a direct access to the
graphic mode.
The bar graph indicates number of meters fed
(METER COUNT) by the selected device (indicated by
the symbol )
The header bar indicates the percentage value of yarn
fed, with respect to the set Target (in this example
41%)
To select a new device.
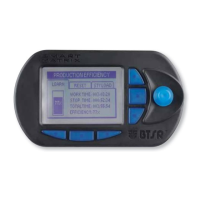
To move to the dynamic display of tension and speed
curves
To increase the scale
To decrease the scale
To indicate either the tension value (T) or the speed
value (S) on the vertical scale.
The continuous line indicates the Tension value.
The dotted line indicates the Speed value.
To move to the following screen, that allows you to
reset the “METER COUNT” counters