60
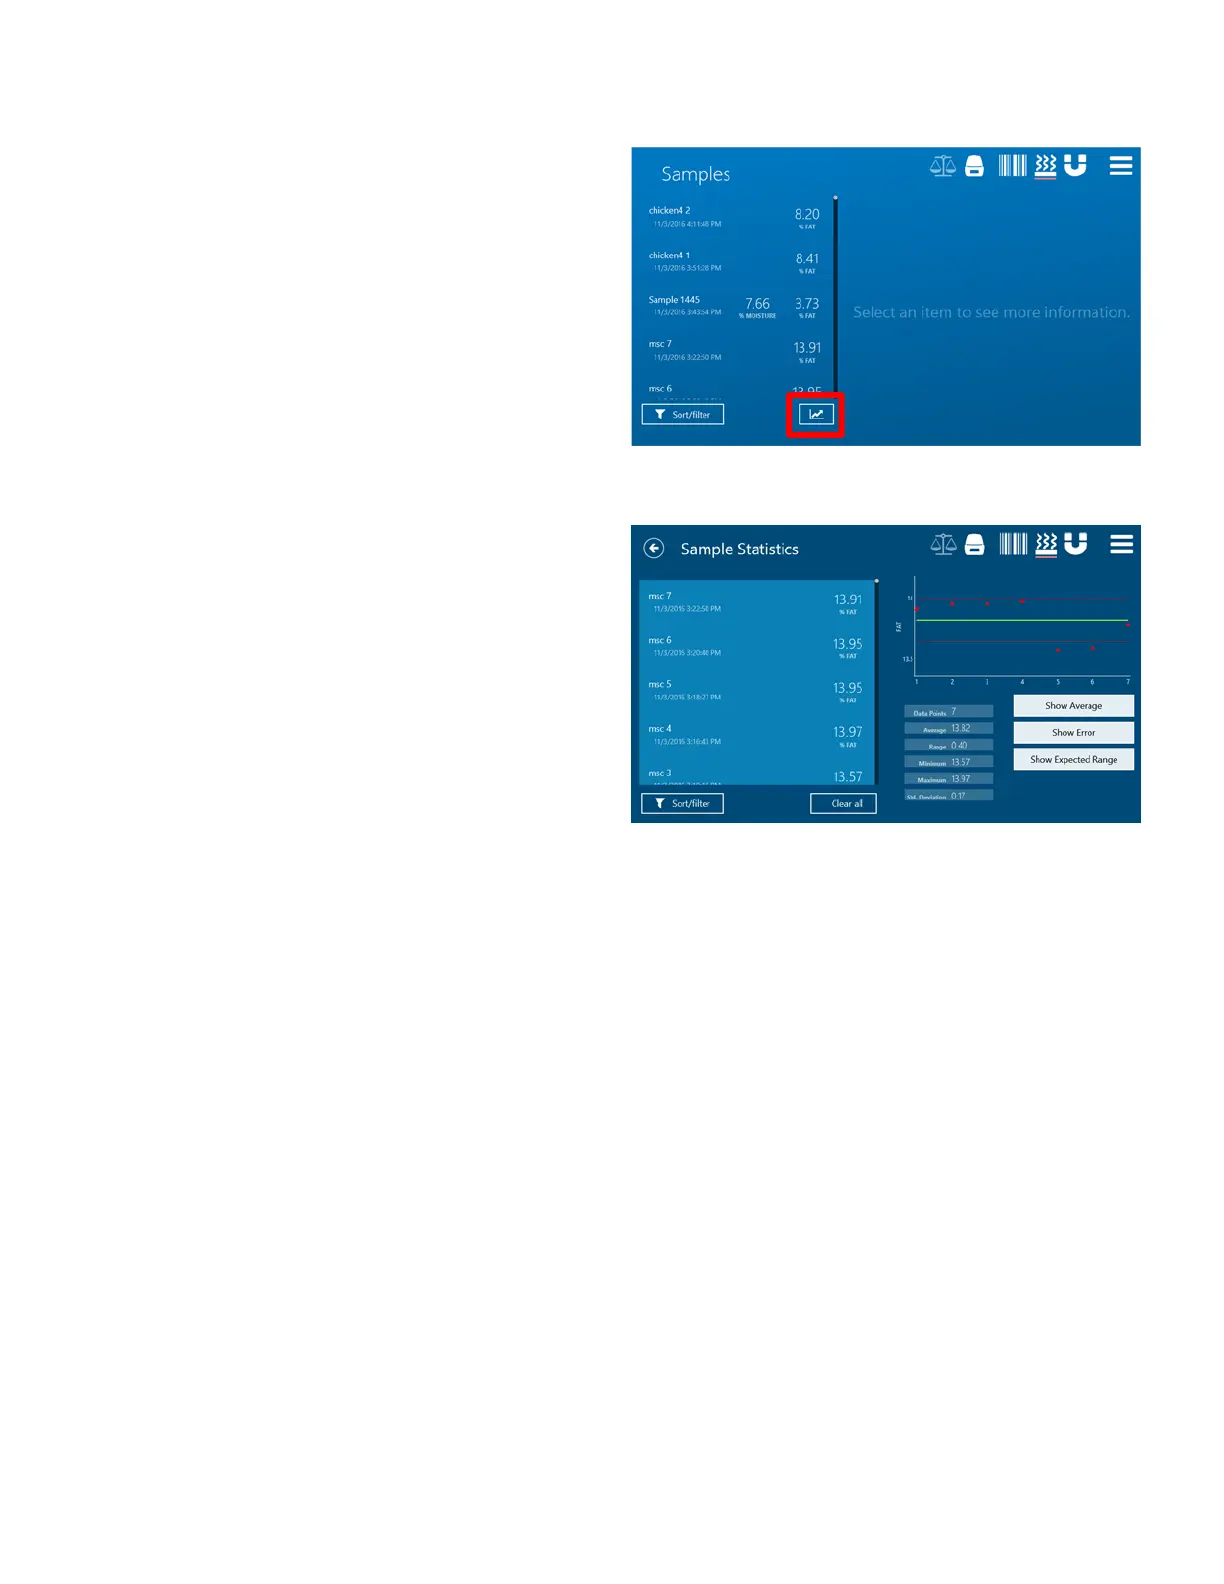
4. The ORACLE also has the ability to generate and
display statistical analysis on results. By pressing
the Statistics icon, the ORACLE will provide users
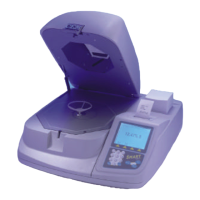
with the option of selecting certain data points to
not only produce statistical analyses such as
Average, Range, Minimum and Maximum, and
Standard Deviation.
5. The ORACLE will also display a Statistical Process
Control chart on which the user can set upper and
lower spec limits to ensure that all results are
within the acceptable specification for that
product. Data can be sort and filtered for statistical
analysis as well.