OCP Test
9.1.18 OCP Waveform Chart
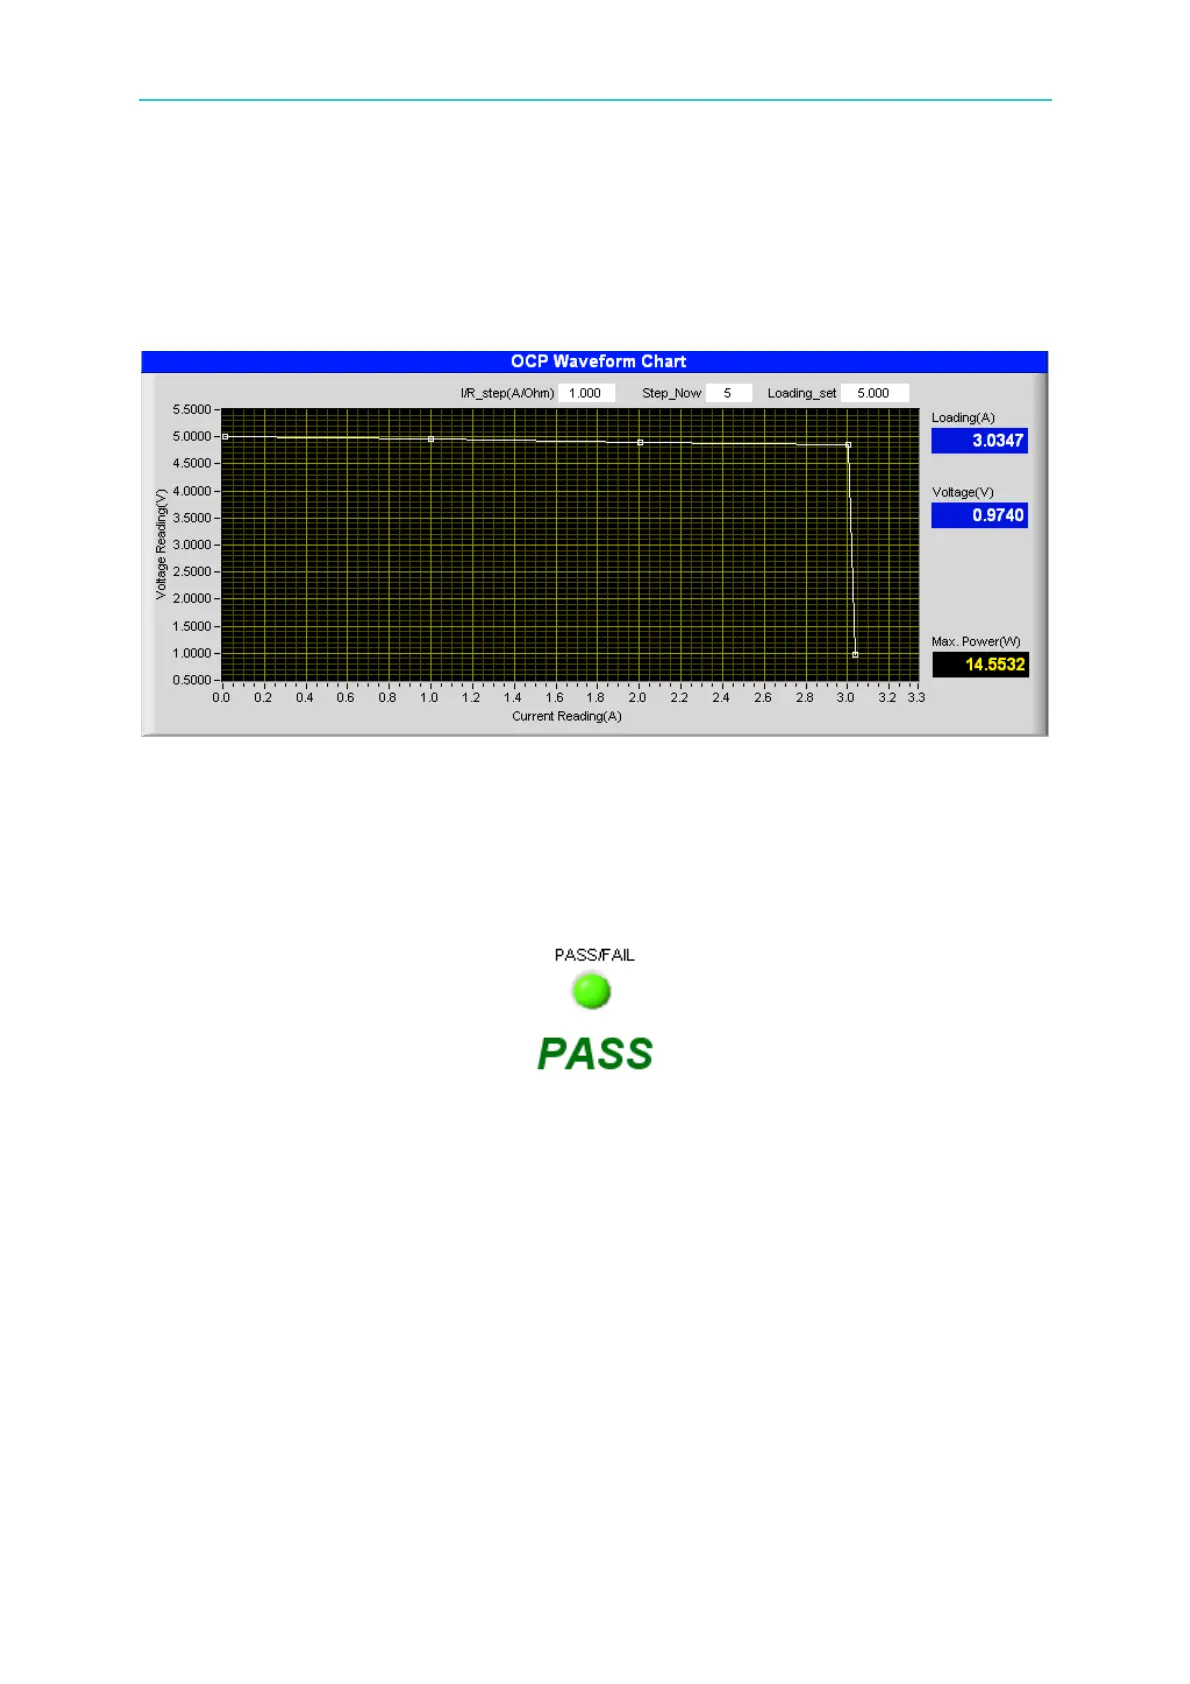
It shows the X-Y waveform chart of current and voltage. When the test begins the software
will keep reading the present voltage/current following different loading current. This
Waveform Chart is a dynamic display and it shows the point of all steps where the Y-axis is
an Auto Scale of voltage and X-axis is the scale of loading current.
Figure 9-19 OCP Waveform Chart
9.1.19 PASS/FAIL
It shows if the measured value is within the Spec range after tested. It shows PASS in
green if the measurement is within the Spec and shows FAIL in red if otherwise.
Figure 9-20 OCP - PASS/FAIL
9.2 SAVE AS, OPEN &BACK
The function of these three buttons is same as Hardware Setting Function; see section 4.4
and 4.5 for detail information.
9.3 Report
OCP test provides a simple, pure text report in *.txt format. See Section 7.10 for the detail
description of report function and its file path as well as filename.
9-5

 Loading...