24
Wibeee
Instruction Manual
5�2�1�- HOME
The Home screen is divided into different areas:
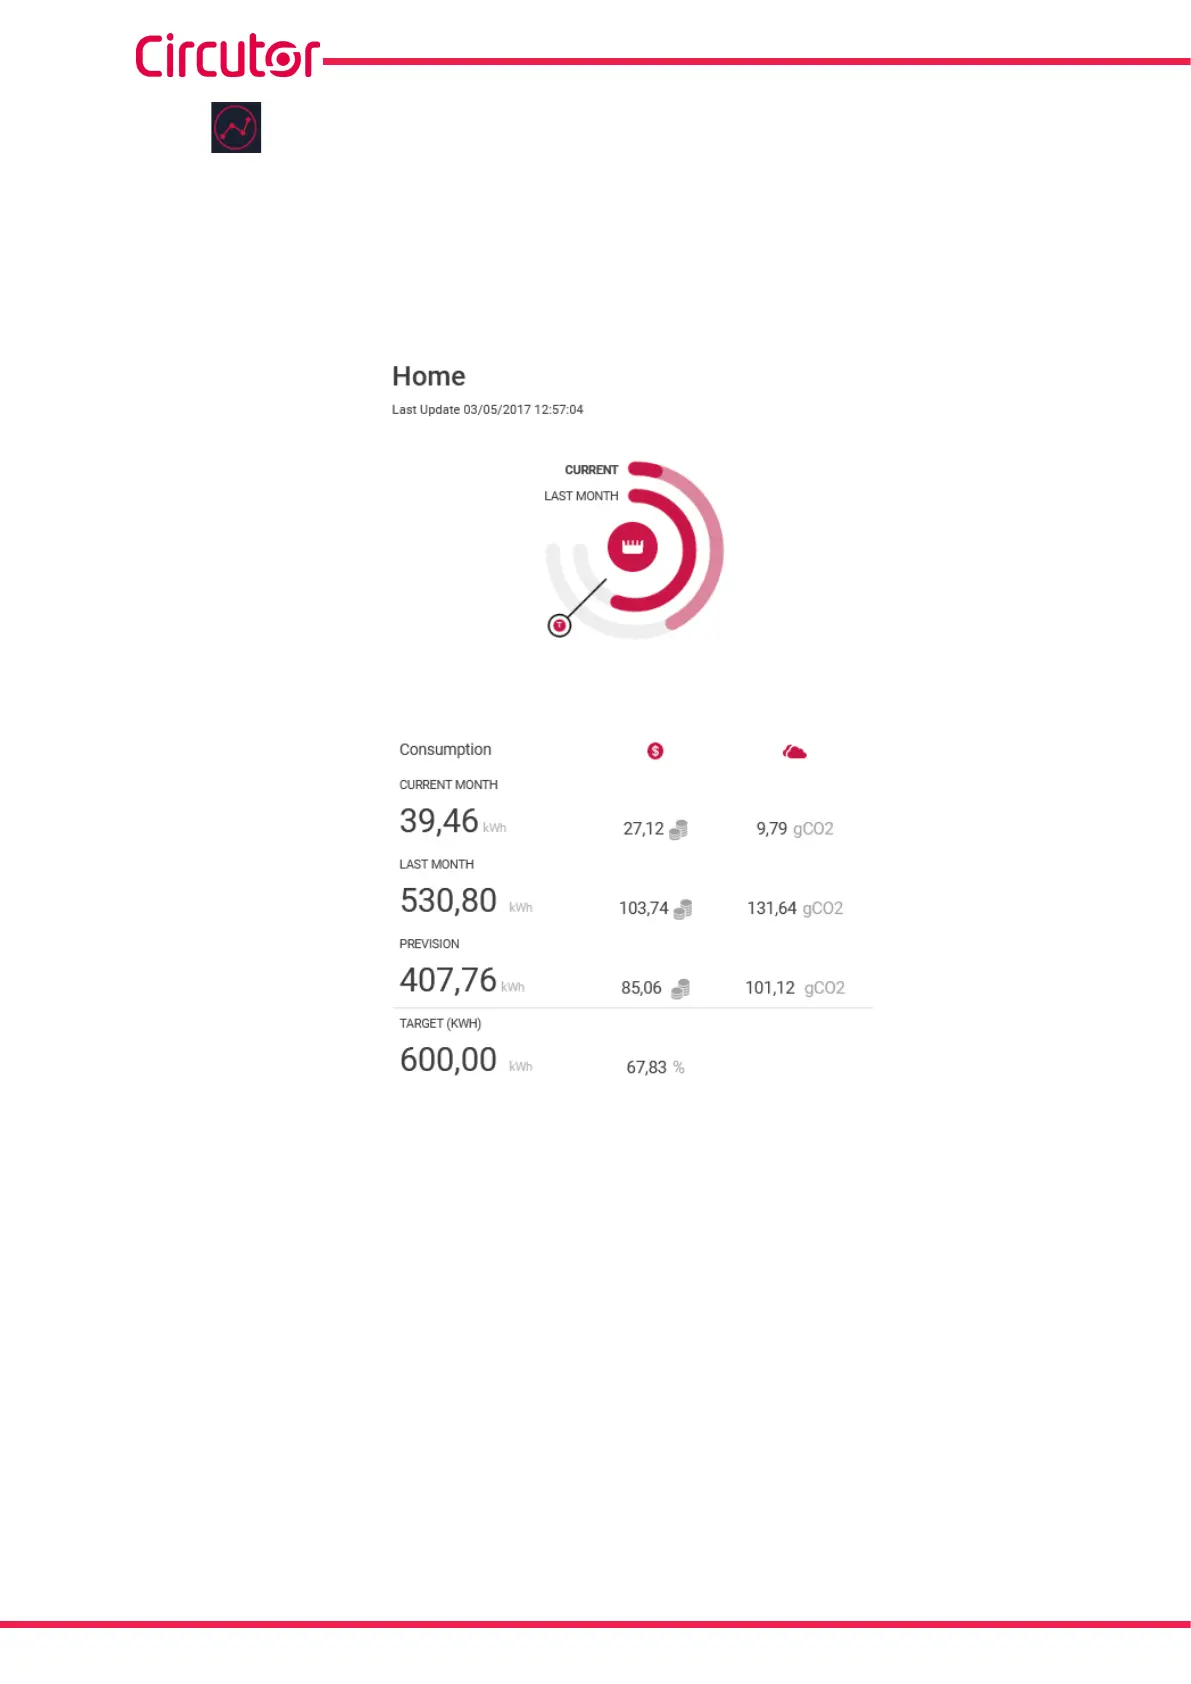
The area in Figure 20 displays a summary of consumption and CO
2
emissions from the
previous month, the current month and the forecast for the end of the month. It also displays
the set target value.
Figure 20: Summary area�
The area in Figure 21 shows 2 of the possible charts that can be viewed. Table 8 and Table
9 show all of the parameters that can be graphically displayed.
Use the < > arrows to toggle between charts.