© 1999-2017 Citrix Systems, Inc. All rights reserved. p.75https://docs.citrix.com
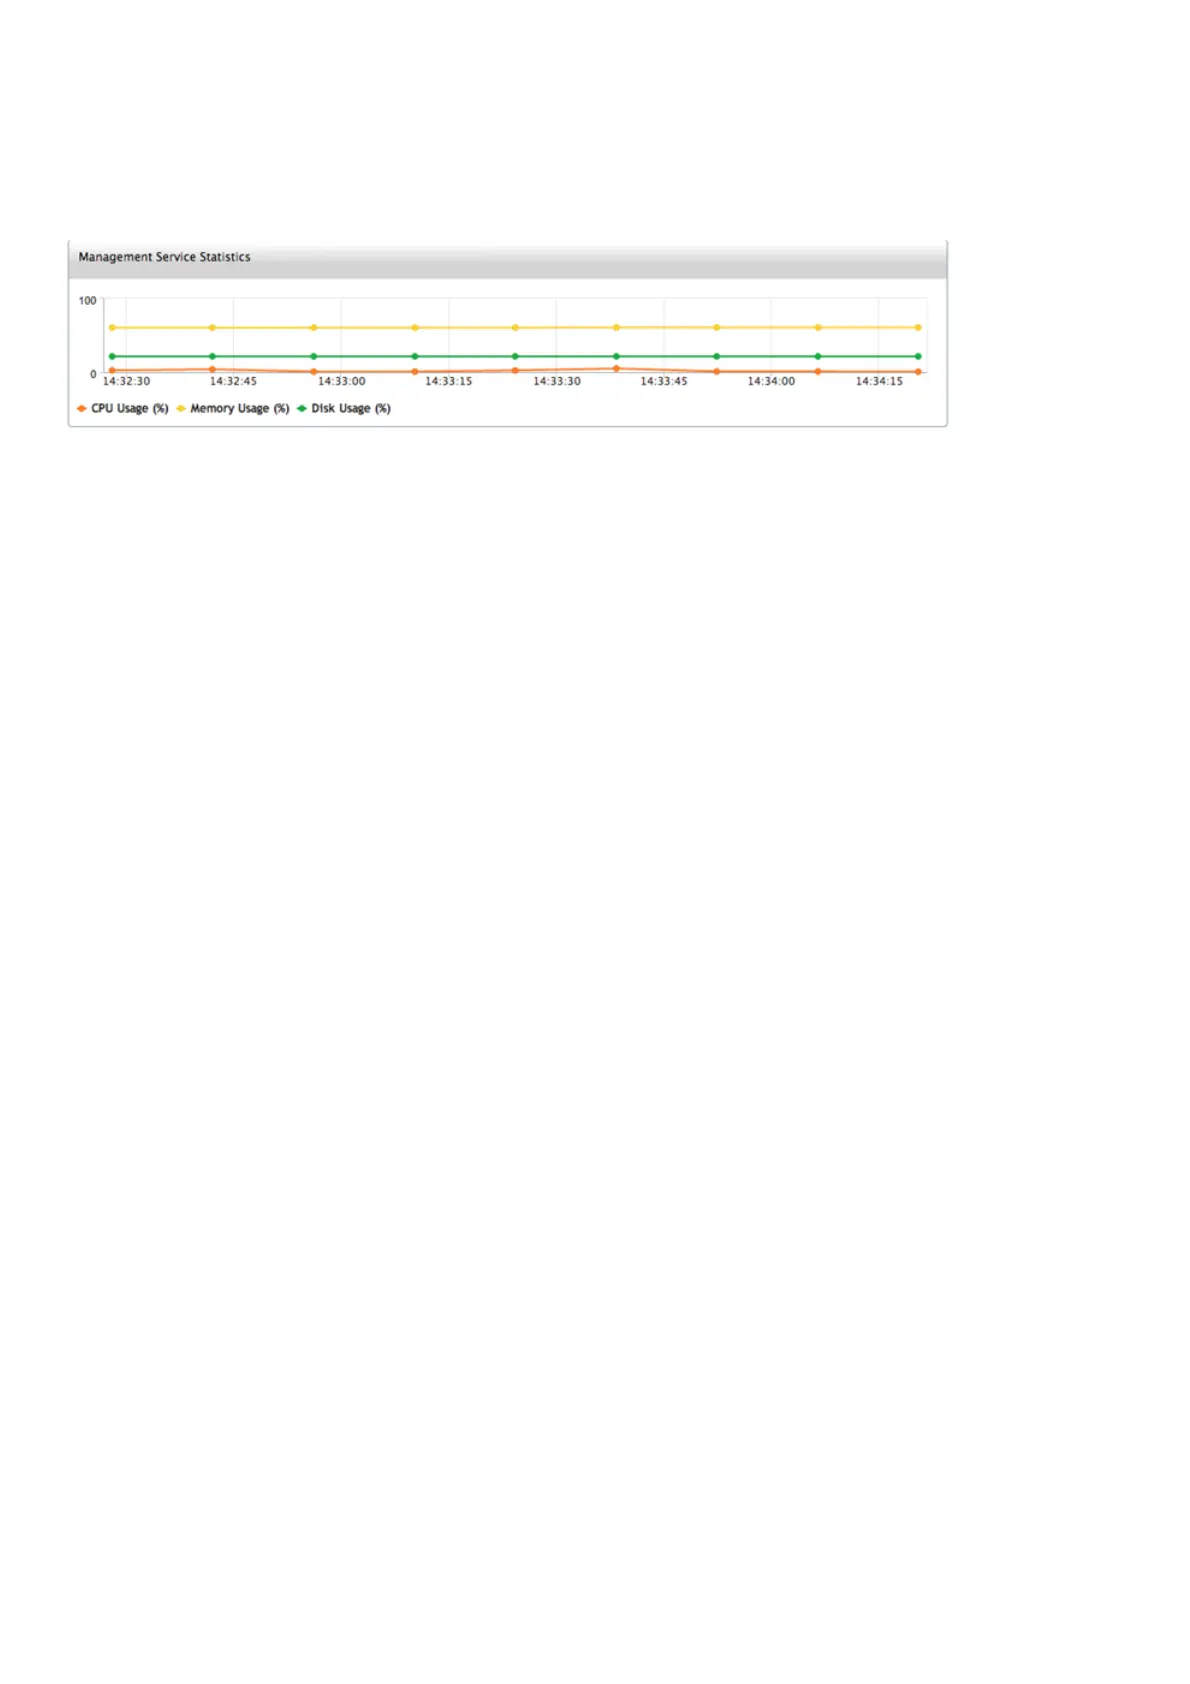
Management Service Statistics
The dashboard now includes Management Service Statistics for monitoring use of memory, CPU, and disk resources by the
Management Service on NetScaler SDX appliance.
Single Sign-On to the Management Service and the NetScaler Instances
Logging on to the Management Service gives you direct access to the NetScaler instances that are provisioned on the
appliance, if the instances are running release 10 build 53 and later. If you log on to the Management Service by using your
user credentials, you do not have to provide the user credentials again for logging on to an instance. By default, the
Timeout value is set to 30 minutes and the configuration tab is opened in a new browser window.
Managing the Home Page
The Management Service Home page provides you with a high-level view of the performance of the SDX appliance and the
instances provisioned on your appliance. SDX appliance and instance information is displayed in gadgets that you can add
and remove depending on your requirement.
The following gadgets are available on the Home page by default.
System Resources
Displays the total number of CPU cores, total number of SSL chips, number of free SSL chips, total memory, and free
memory on the appliance.
System CPU | Memory Usage (%)
Displays the percentage of CPU and memory utilization of the appliance in graphical format.
System WAN/LAN Throughput (Mbps)
Displays the total throughput of the SDX appliance for incoming and outgoing traffic in a graph that is plotted in real time
and updated at regular intervals.
NetScaler Instances
Displays the properties of the NetScaler instances. The properties displayed are Name, VM State, Instance State, IP
Address, Rx (Mbps), Tx (Mbps), HTTP Req/s, and CPU Usage (%) and Memory Usage (%).
Note: On first log on, the Home page does not display any data related to the NetScaler instances because you have not
provisioned any instances on your appliance.
Health Monitoring Events
Displays the last 25 events, with their severity, message, and the date and time that the event occurred.
You can do the following on the Home page:
View and hide NetScaler instance details
You can view and hide the details of a particular NetScaler instance by clicking the name of the instance in the Name
column. You can also click Expand All to expand all the instance nodes and Collapse All to collapse all the instance nodes.
Add and remove gadgets