Introduction to the web interface
98-175666-D Chapter 3: Setup of the antenna 3-6
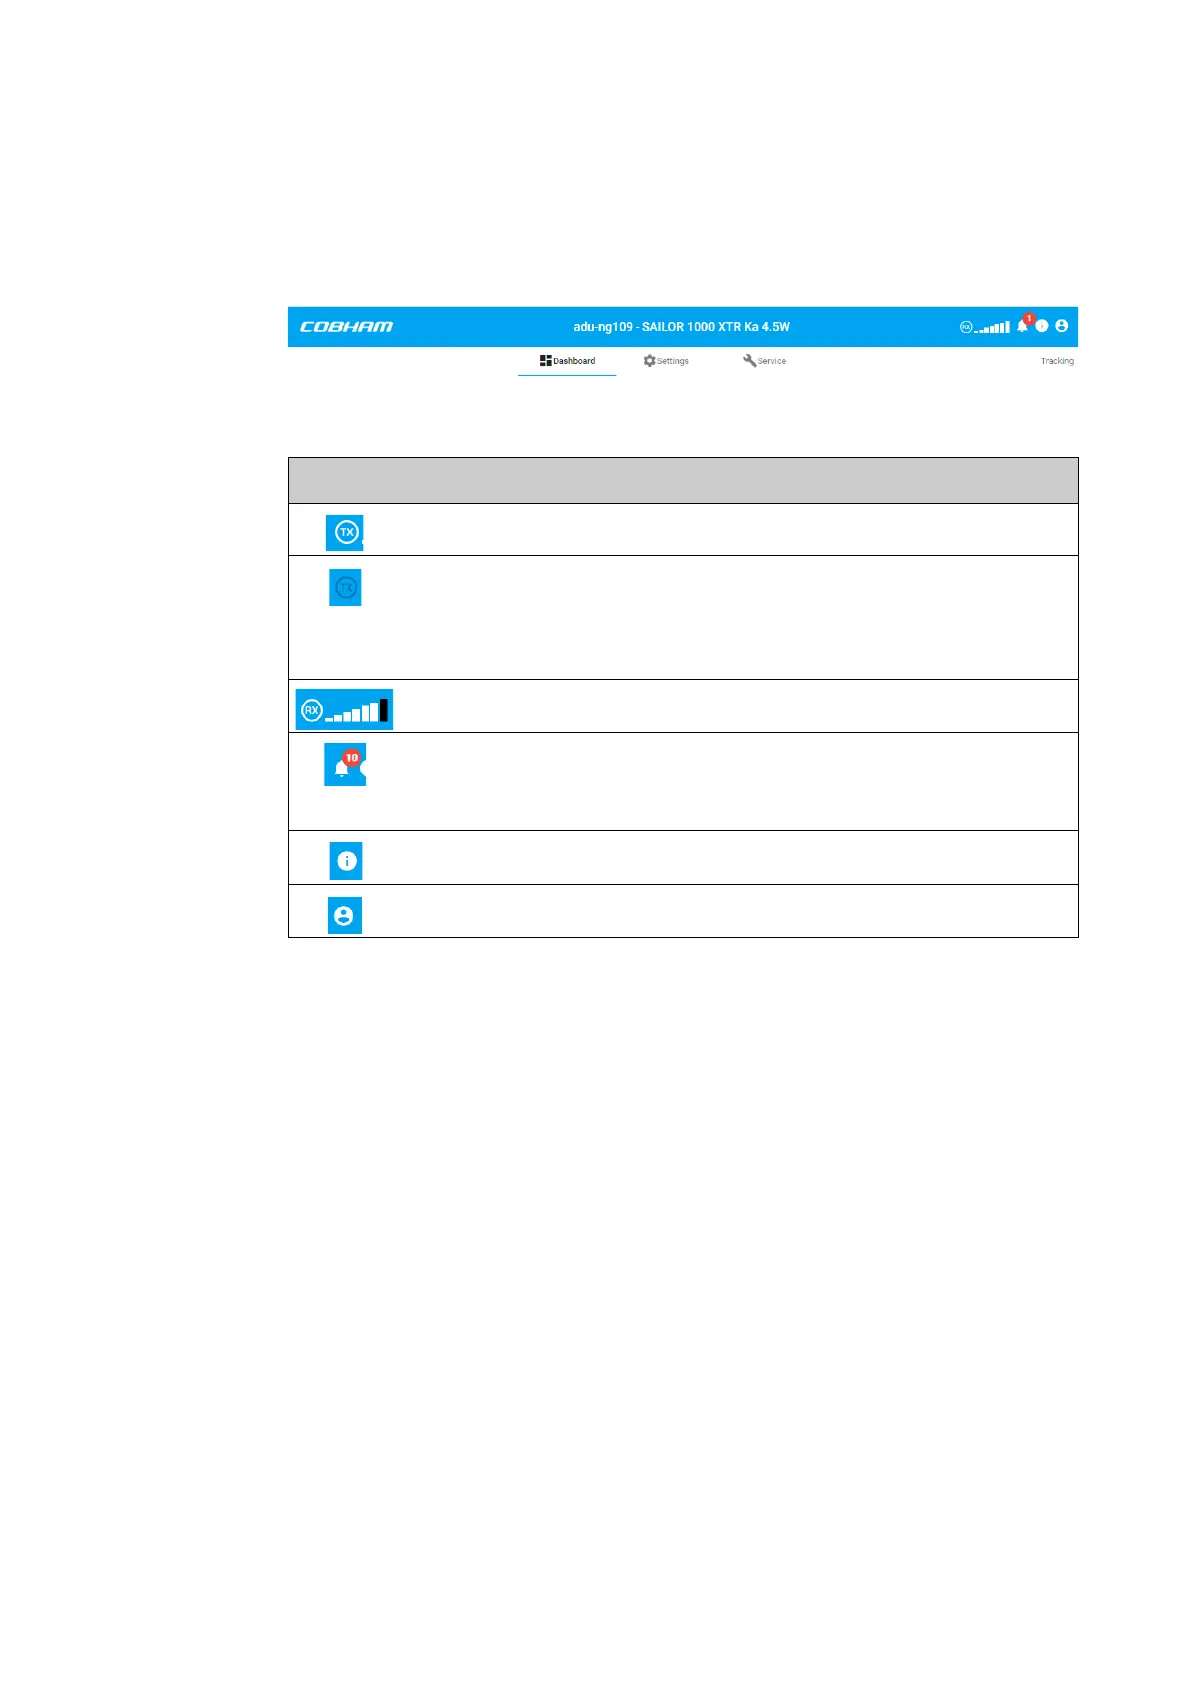
Top bar
The top bar shows the host name and antenna model. It also has icons to report on the
current status of the antenna. Underneath the top bar, to the right, the current
antenna status is shown, e.g. Tracking.
Figure 3-5: Top bar of the web interface (example)
Icon Explanation
TX icon, white: BUC unmuted, black: BUC muted
TX signal.
White: TX signal present,
dark blue: No TX selected in Blocking zone,
strike-through: No TX and system in blocking zone
Rx signal strength
System messages, number of active errors and warnings. Mouse over
will show a list of the first 5 messages, a click on the list will display the
event list.
About and contact information
Logout
Table 3-2: Icons in the top bar
 Loading...