20
ENGLISH
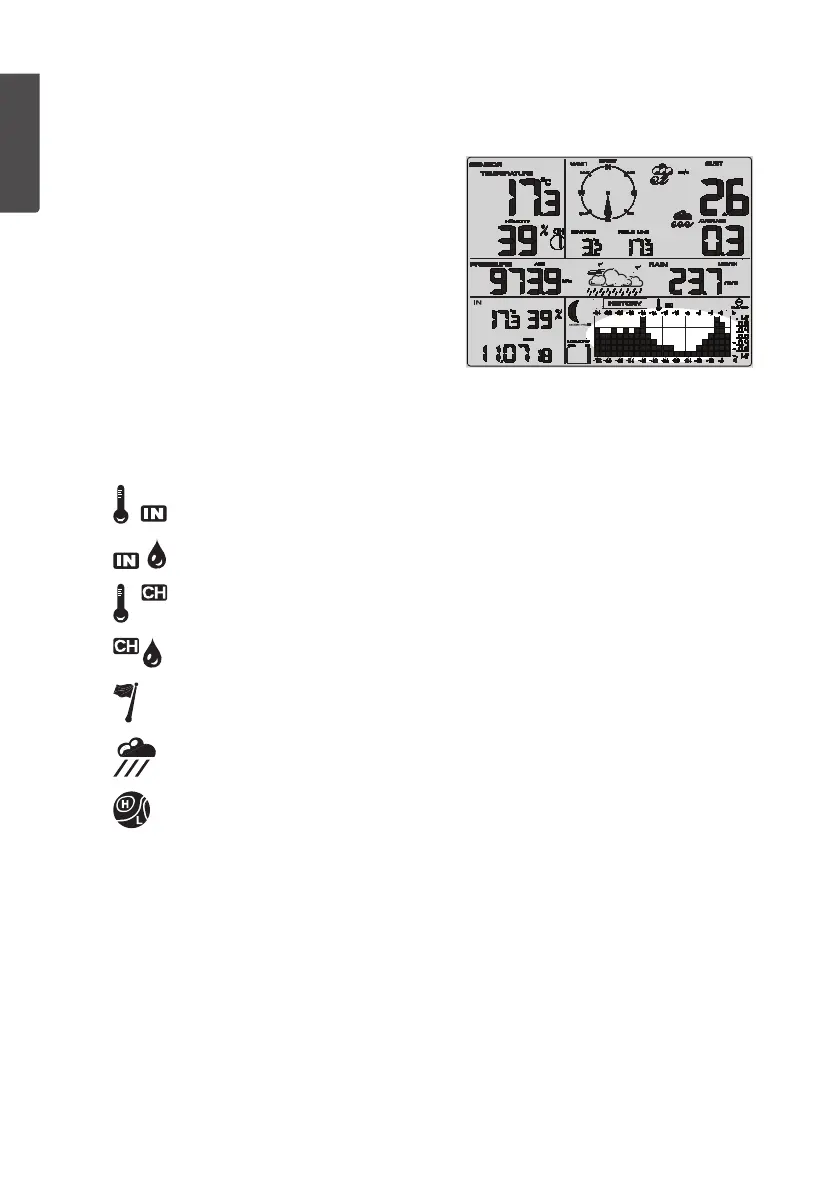
Histograms, weather forecast and moon phases
Histograms
Theweather station can display recorded
measurement data for thepast 24 or 72 hours.
See theChange display mode for time/date
and measurement values section.
Thevertical axis shows thehistorical changes
compared to thecurrent measurement value.
Thecurrent measurement value (thecolumn
furthest to theright) always shows 0.
E.g. when displaying thetemperature histogram:
If thecolumn shows 0.4, this represents
ahistorical temperature 0.4 degrees higher
than thecurrent temperature.
In normal mode, press [ HISTORY/− ] repeatedly to switch between thefollowing histograms:
Indoor temperature
Indoor humidity
Outdoor temperature (CH1)
Outdoor humidity (CH1)
Wind
Precipitation
Air pressure