14
2. Advanced Power Management
Intelligent PDU Web Interface
2.2 Visible Power Consumption
With comprehensive energy measurement data, users can gain more visibility to the
total power usage of a PDU, as well as estimate the energy cost and CO2 emissions.
The energy-trend report also helps users analyze their power utilization and to review
the history of power conditions. See Log Tab > Status Records, Log Tab > Graphing,
Log Tab > Energy Records, and Log Tab > Maintenance.
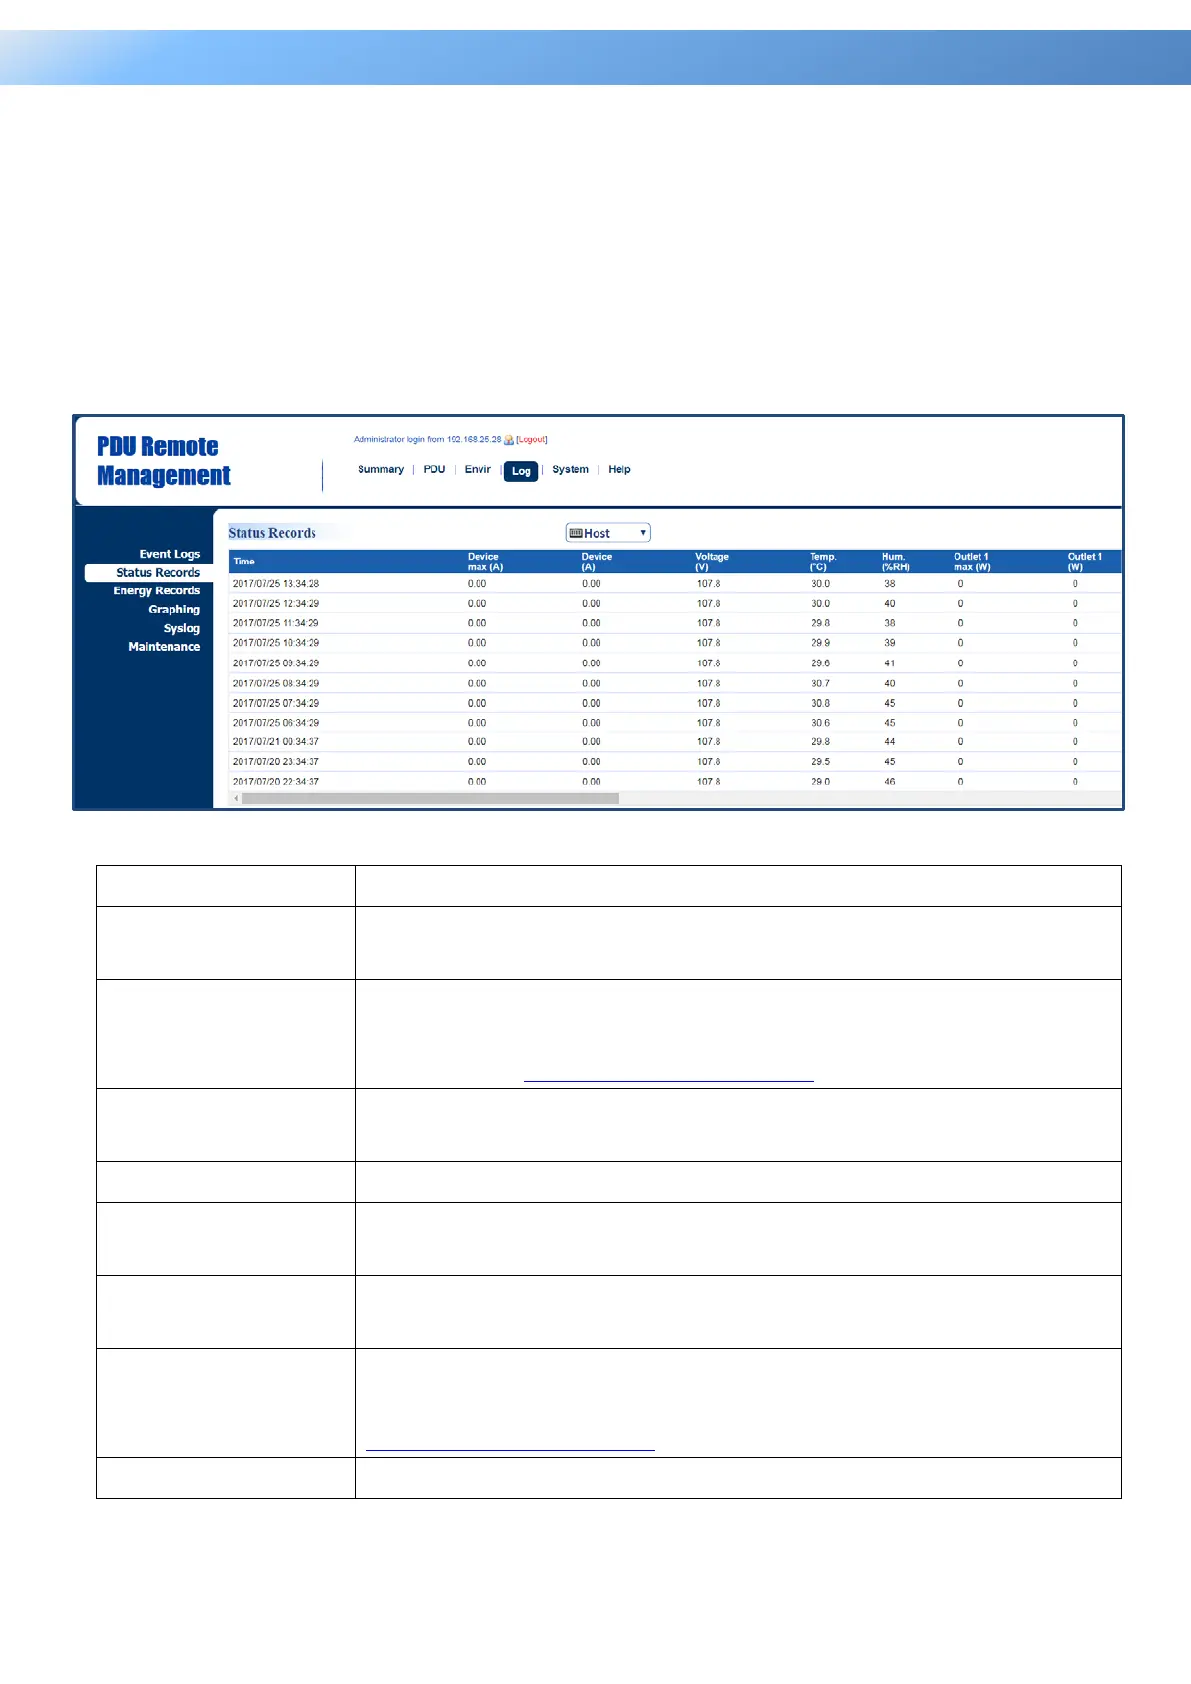
Log Tab > Status Records
Item Definition
HOST/GUEST#
Select the role of PDU (HOST or GUEST#) if PDUs are daisy
chained. Up to 3 GUEST PDUs can connect to 1 HOST PDU.
Device Max (A)
The maximum load current of the connected device(s) or bank
during a specific time interval, measured in Amps. This interval
can be set in
.
Device (A)
Load current of the connected device(s) or bank, measured in
Amps.
Voltage (V) Voltage of the utility power.
Te m p. (°C)
Temperature reading when the ENVIROSENSOR is connected
to the PDU.
Hum. (%RH)
Humidity reading when the ENVIROSENSOR is connected to
the PDU.
Outlet # Max (kW)*
The maximum load power of a specific outlet during a specific
time interval, measured in Kilowatts. This interval can be set in
.
Outlet # (kW)* Load power of a specific outlet, measured in Kilowatts.
*For Switched Metered by Outlet Series only.

 Loading...