10 Manual RS.8A.N5.02 © Danfoss 10-2007 m2 Version 3.11
The format of the printout will be as shown:
To display an instant graph of the currently selected point, from the Point Detail
screen, press the ‘ ’ key. The chart is then displayed.
The default time scale for the data displayed depends on the sample rate set.
For example, a sample rate of 15 minutes will give a default time scale of 1 day.
To view historic data, press the ‘ ’ or ‘ ’ keys to page the graphic screens
(with no overlap). Pressing the ‘ ’ or ' ' keys scroll through each of the points
displaying the data graphs.
Press the ‘↵’ to bring up the cursor, this can then be moved along left or right
displaying the reading and time for the cursor position in the top right hand
corner of the screen. In addition the screen will page left or right when the
cursor reaches the end of the display.
To zoom in or out press the ' ' or ' ' keys, this will display the following time
spans:
45 mins 12 hours 4 weeks
1.5 hours 1 day 12 weeks
3 hours 3.5 days 11 months
6 hours 1 week
To exit the zoom facility, remove the graph cursor by pressing '↵' again.
Pressing the ' ' key will then take you back to the Point Detail screen.
When a graph is displayed on the screen, pressing the ' ' key dumps the
graph to a directly connected printer (cursor must be removed rst).
A pulsed input function is available for accepting pulses from a power meter.
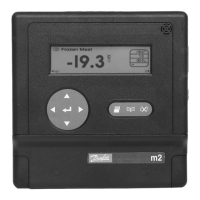
The pulsed input is displayed as shown which includes two values. The large
value is the ‘Rate’ and indicates either current kW usage (Const) once per
minute or the ‘Peak’ kW usage within the current sample period.
If the ‘Rate’ current usage is displayed, this value will vary with the actual energy
consumed within the last minute. If the ‘Peak’ usage is displayed, this will only
change if the usage in the last minute was greater than any other minute in the
sample period - hence it will show the highest or ‘Peak’ value. The ‘Rate’ value is
stored by the m2 and will be displayed in the graph associated with this point.
The second smaller value will show the accumulated kWh used within the
current sample period. This value will increase over the sample period then
reset to zero at the end.
The ‘Pulsed Icon’ to the left of the display will change from to each time a
pulse is being received.
Graphics
Pulsed Input