Getting Started
6 Danfoss Turbocor Compressors Inc.
ECD-00007M Rev. 1
3.4.2 Entering User Input
When user input is required for the monitor program fields,
perform the following sequence:
1. Double-click the variable field. (This activates the field
for user input.)
2. Scroll or type in the new setting.
3. Press Enter. It is important to press Enter as this causes
the user input to be validated.
3.5 Serial Port Connection
The Serial Port Connection window contains fields that
must be filled in order to enable communication between
the monitor program and the compressor; refer to Figure 4.
The comm settings of the compressor must be known in
order for the monitor program to communicate with the
compressor.
To access the “Serial Port Connection” window, select
“Window”→ “Connection” from the menu bar, or click on
the “Serial Port Connection” icon located below the menu
bar.
The following paragraphs describe the dialog box fields.
Comm Port - Serial communication port that the computer
will use to connect to the compressor. Enter the COM port
number such as COM1 or COM2, etc.
Baud Rate -19,200 or 38,400 baud (38,400: default)
Stop Bits - 1 or 2. (1: default)
Slave Address - 1-63. (1: default)
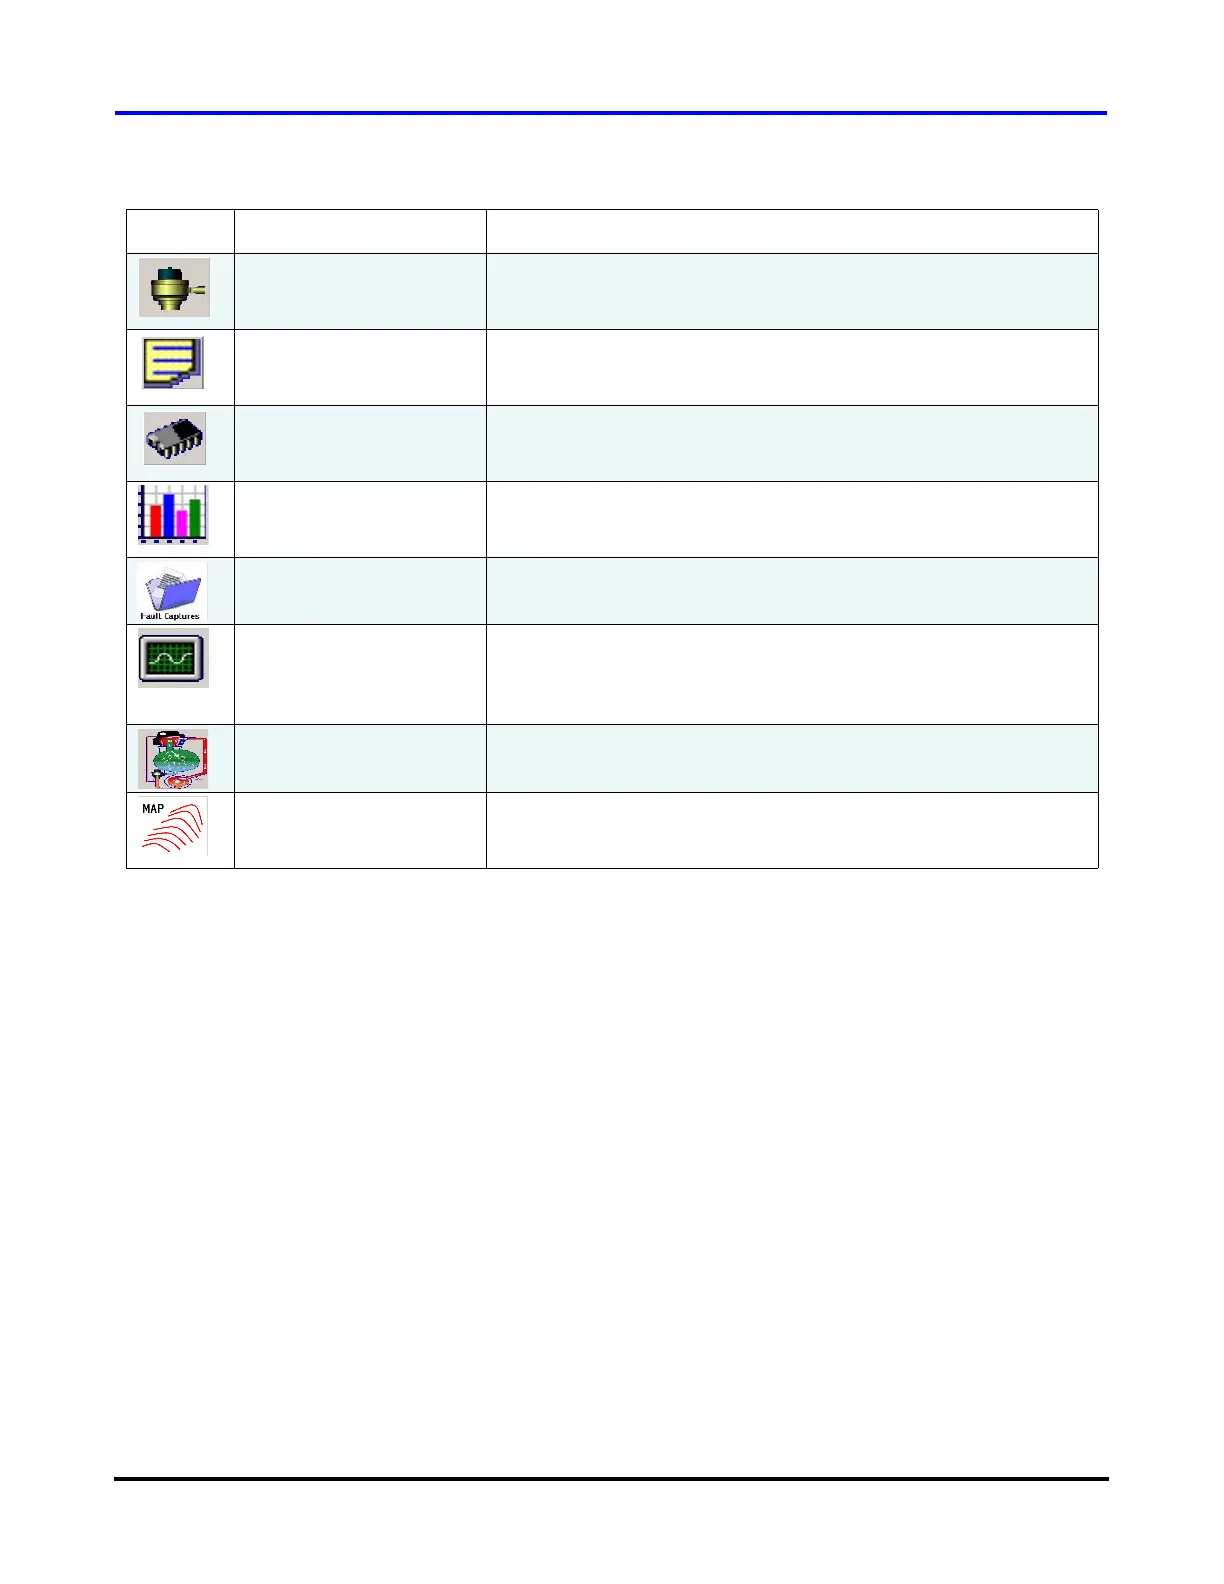
Expansion Valves Clicking on the “Expansion Valves” icon opens the “Electronic
Valve / Data Tuning” window. Refer to section 6.6 "Electronic
Valve Data / Tuning" on page 33.
Event Log Clicking on the “Event Log” icon opens the “Compressor Event
Log” window. Refer to section 6.10 "Compressor Event Log" on
page 51.
EEPROM Settings Clicking on the “EEPROM Settings” icon opens the “EEPROM
Settings” window. Refer to section 6.9 "EEPROM Settings" on
page 39.
Load Profile Graphs Clicking on the “Load Profile Graphs” icon opens the “Compressor
History Data” window. Refer to section 6.11 "History Data" on page
52.
Fault Captures Clicking on the “Fault Captures” icon opens the “Fault Captures”
window. Refer to section 6.14 "Fault Captures" on page 59.
Trending Clicking on down arrow next to the “Trending” icon, and selecting
“Charts 1” opens the trending “Graphs” window; selecting on
“Charts 2” opens the “Trending and Data Acquisition” window.
Refer to section 6.12 "Trending" on page 53.
Chiller Control Clicking on the “Chiller Control” icon opens the “Chiller Control”
window. Refer to section 6.7 "Chiller Control" on page 36.
Compressor Envelope Clicking on the “Compressor Envelope” icon opens the
“Compressor Map” window. Refer to section 6.13 "Compressor
Map" on page 57.
Table 2 Monitor Program Toolbar Icons (Continued)
Icon Name Description
 Loading...