3) Use Record Range to define a Starting and Ending range, or select the All Records checkbox to
display all records available. Options default to All Records, but unchecking the box enables you to
set a smaller range.
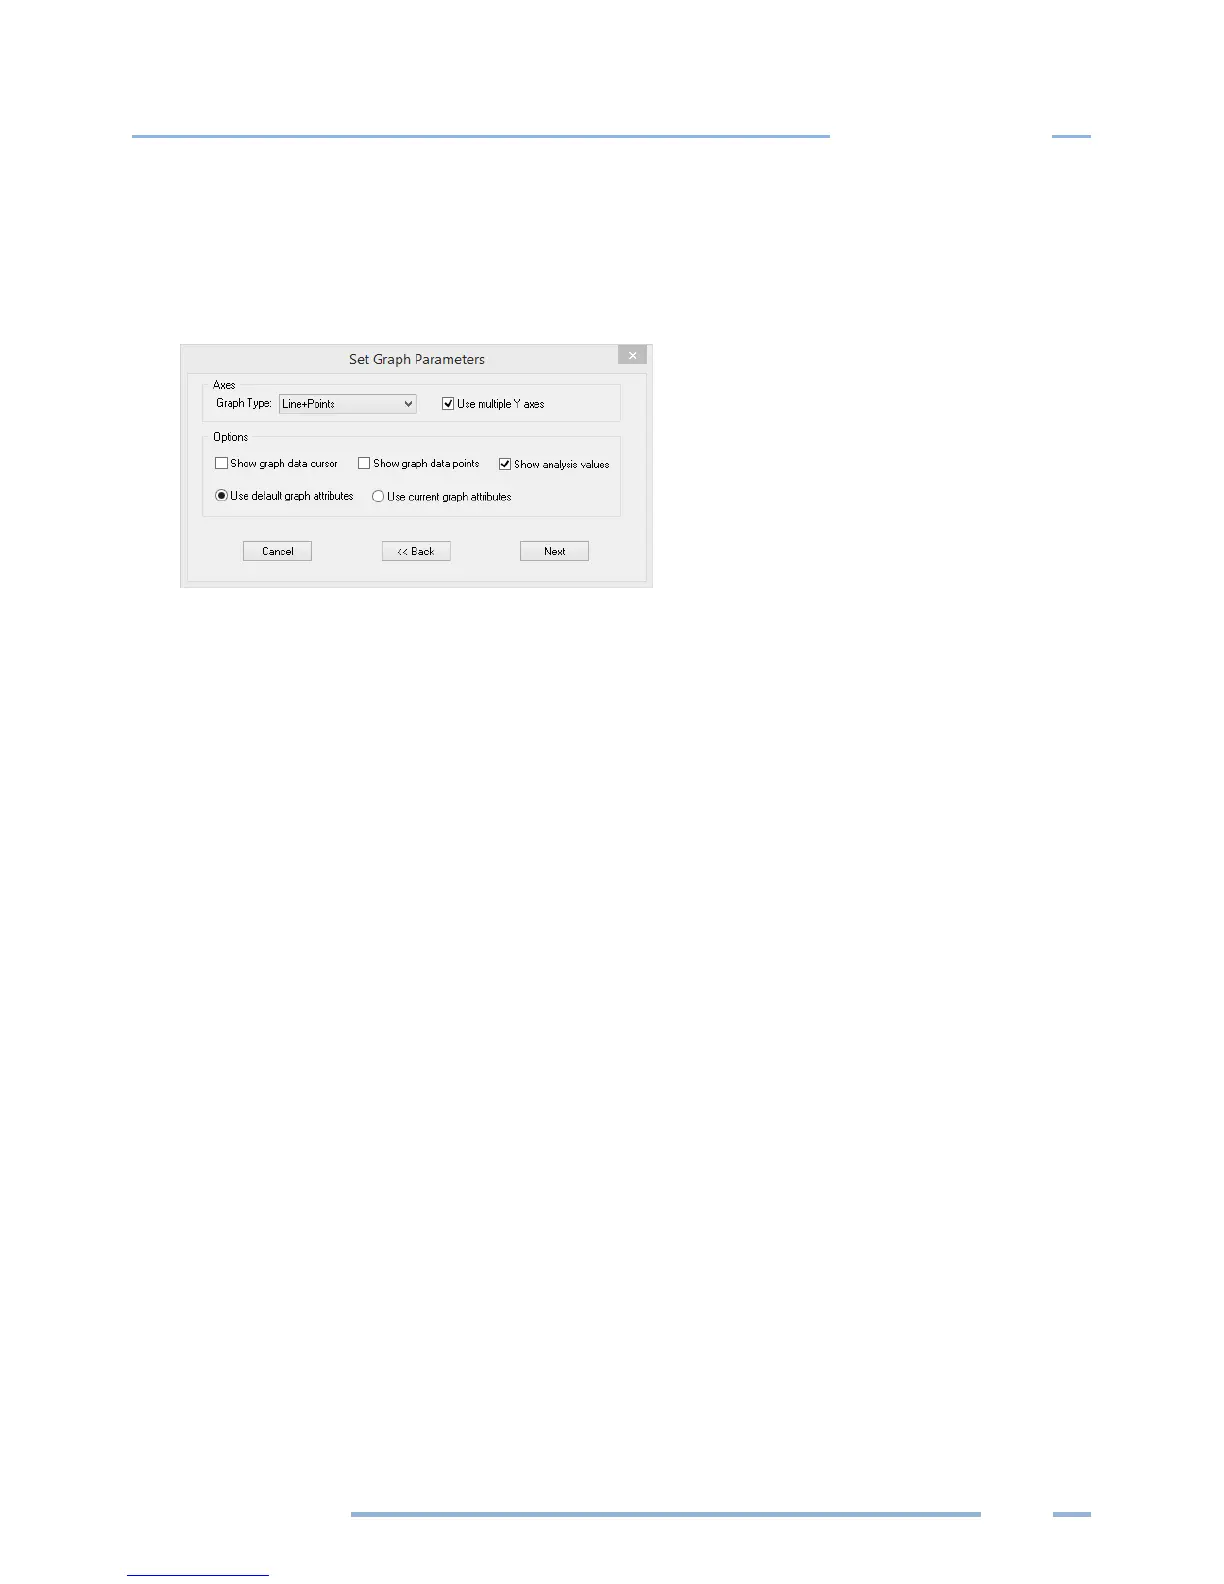
4) Click Next to go to the Set Graph Parameters dialog window to select the type of graph to create.
5) In the Axes section, select the Graph Type in the drop-down menu. You may also choose to select
the Use Multiple Y Axes checkbox if you have chosen more than one parameter to graph and they
have very different ranges (e.g., kW and Power Factor). The option to assign the Y axes is displayed
after clicking Next.
6) In the Under Options section, select the checkboxes for the functions you want to use:
Show graph data cursor—the data cursor appears when the graph is created (you can also toggle
the data cursor on and off with the right mouse button).
Show graph data points—displays the Data Point information above the graph display.
Show analysis values—shows summary statistics (minimum, maximum, average) on the graph.
Use the radio buttons to select one of the following:
a) Use default graph attributes—uses the default color, font and other graph attributes.
b) Use current graph attributes—uses the attributes selected for the last graph.
7) Click Next.
If the Use multiple Y axes checkbox was selected the Select Y-Axis Assignments window displays in
order for you to assign parameters to the Y axes.