M I N I - C U B E – U S E R M A N U A L
Rev 1.3 06/2018 48/59
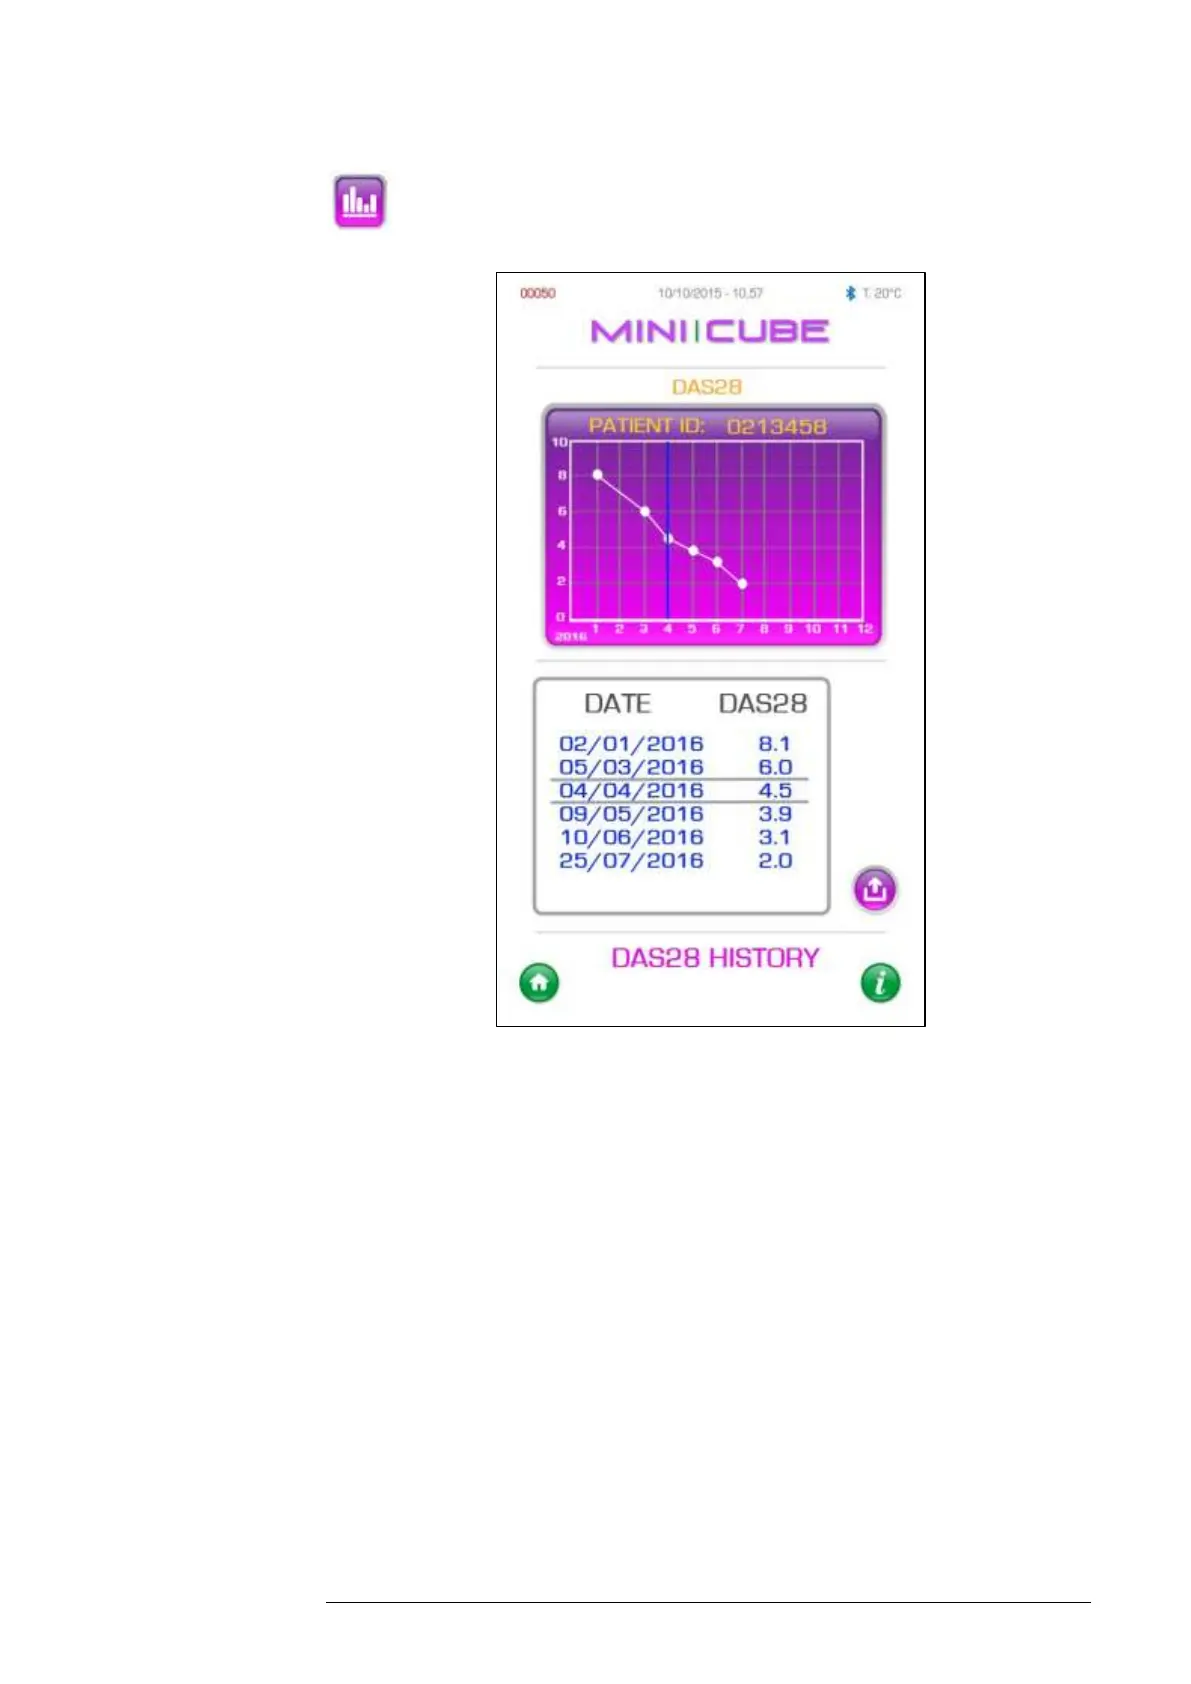
From the DAS28 home page, click on the chart to go to the page with
historical data on the sample (Fig.7.5)
Fig. 7.5
The chart shows the month and year when measurements were taken on the x
axis, and DAS28 values on the y axis. A vertical blue line indicates the
corresponding point for the date selected in the list below, which lists all analyses
for the patient. Click on export to print the entire page displayed.