2388-MANUL-V10.00.00-UTP2 Operating Manual
Page 8 of 74
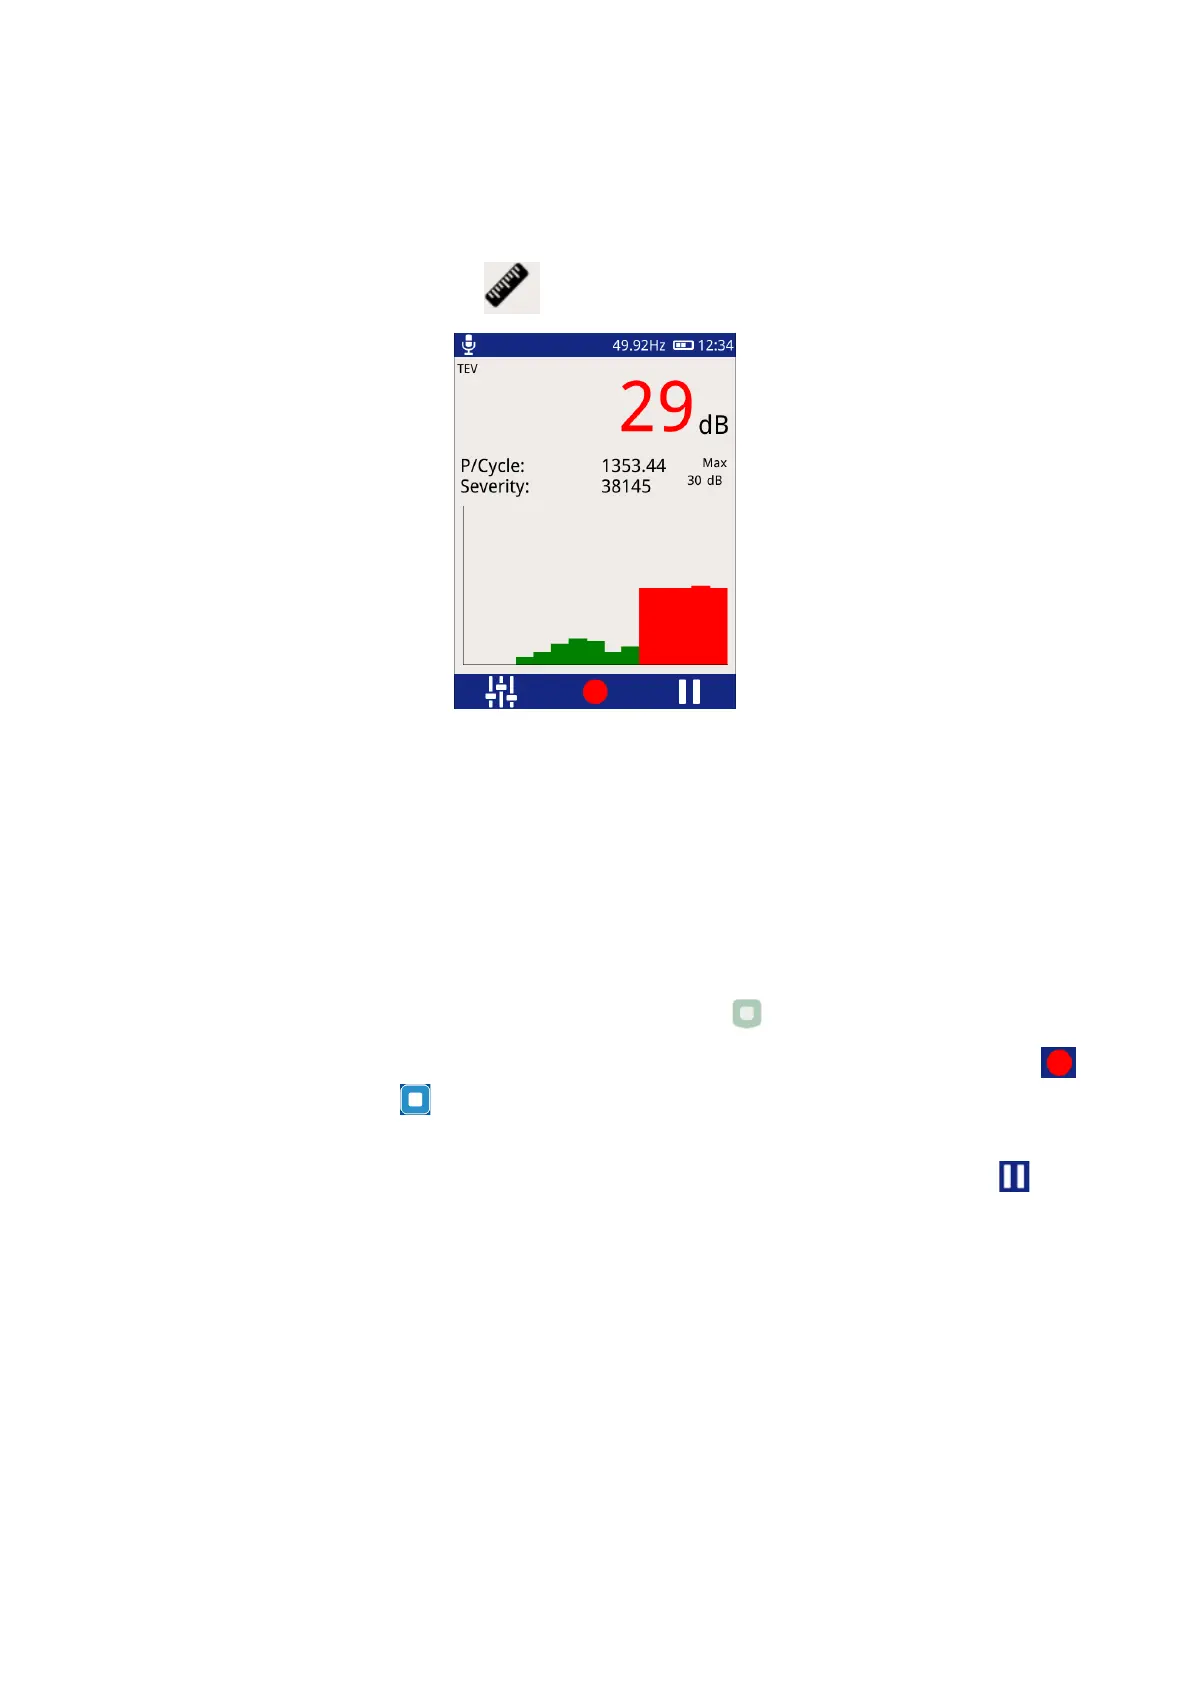
3.9.1 Measure Screen
The Measure mode is common to both TEV and Cable PD. This mode displays TEV readings in dBmV (dB) or (if
the HFCT accessory is connected) Cable PD readings in picoCoulombs (pC).
To enter this mode, click the Measure icon .
P/Cycle – Shows the pulses per cycle based on either a 50 or 60Hz mains frequency.
Severity – Shows the short term severity (calculated by multiplying TEV magnitude (mV) by Pulses Per Cycle).
When in Cable PD mode, this is calculated by Charge (pC) multiplied by Pulses Per Cycle.
Max dB – displays the maximum dB value registered by the UTP2
since the screen was entered or paused/reset.
This value is displayed in pC.
Chart - The bar chart is used to show the amplitude of the current values being read by the UTP2, from right to
left.
To exit the TEV screen back to the main menu, press the Home button .
There is an option to record a reading, this can be done by either clicking the red record icon on the screen
or by pressing the Middle button . All recordings are stored within a ‘survey’ detailed in a later section of this
manual.
Pausing a reading can also be achieved by either presing the Right button or clicking on the ‘Pause’ icon.
Audio output is also muted during a pause operation. After pausing the screen the measurment can be
restarted by pressing the restart button.
3.9.2 Phase Plot
The Phase Plot mode is common to both TEV and Cable PD. The upper section of the screen shows
measurement values as detailed previously under the ‘Measure Screen’. The lower section contains a phase
resolved intensity plot ‘Phase Plot’ of the measured activity.
The plot displays either TEV or Cable PD events’ phase angles (x-axis) against their amplitude (y-axis). The
colour scale represents the intensity (pulse count) at a given phase angle and amplitude.