2388-MANUL-V10.00.00-UTP2 Operating Manual
Page 9 of 74
This option is useful for distinguishing between whether a measured PD activity is a genuine discharge source
or just noise. For example, genuine PD activity may manifest itself as a stable phase resolved plot which will
occur at the same position with respect to phase angle cycle by cycle; whilst white noise will not be phase
related occurring at irregular positions on the phase plot.
The Pause and Record option is also available in this mode; Severity and P/Cycle are calculated as described
under the Measure Screen.
To zoom in on a chart, slide your finger from bottom left to top right of the area of interest. To zoom out draw
a diagonal line from top right to bottom left.
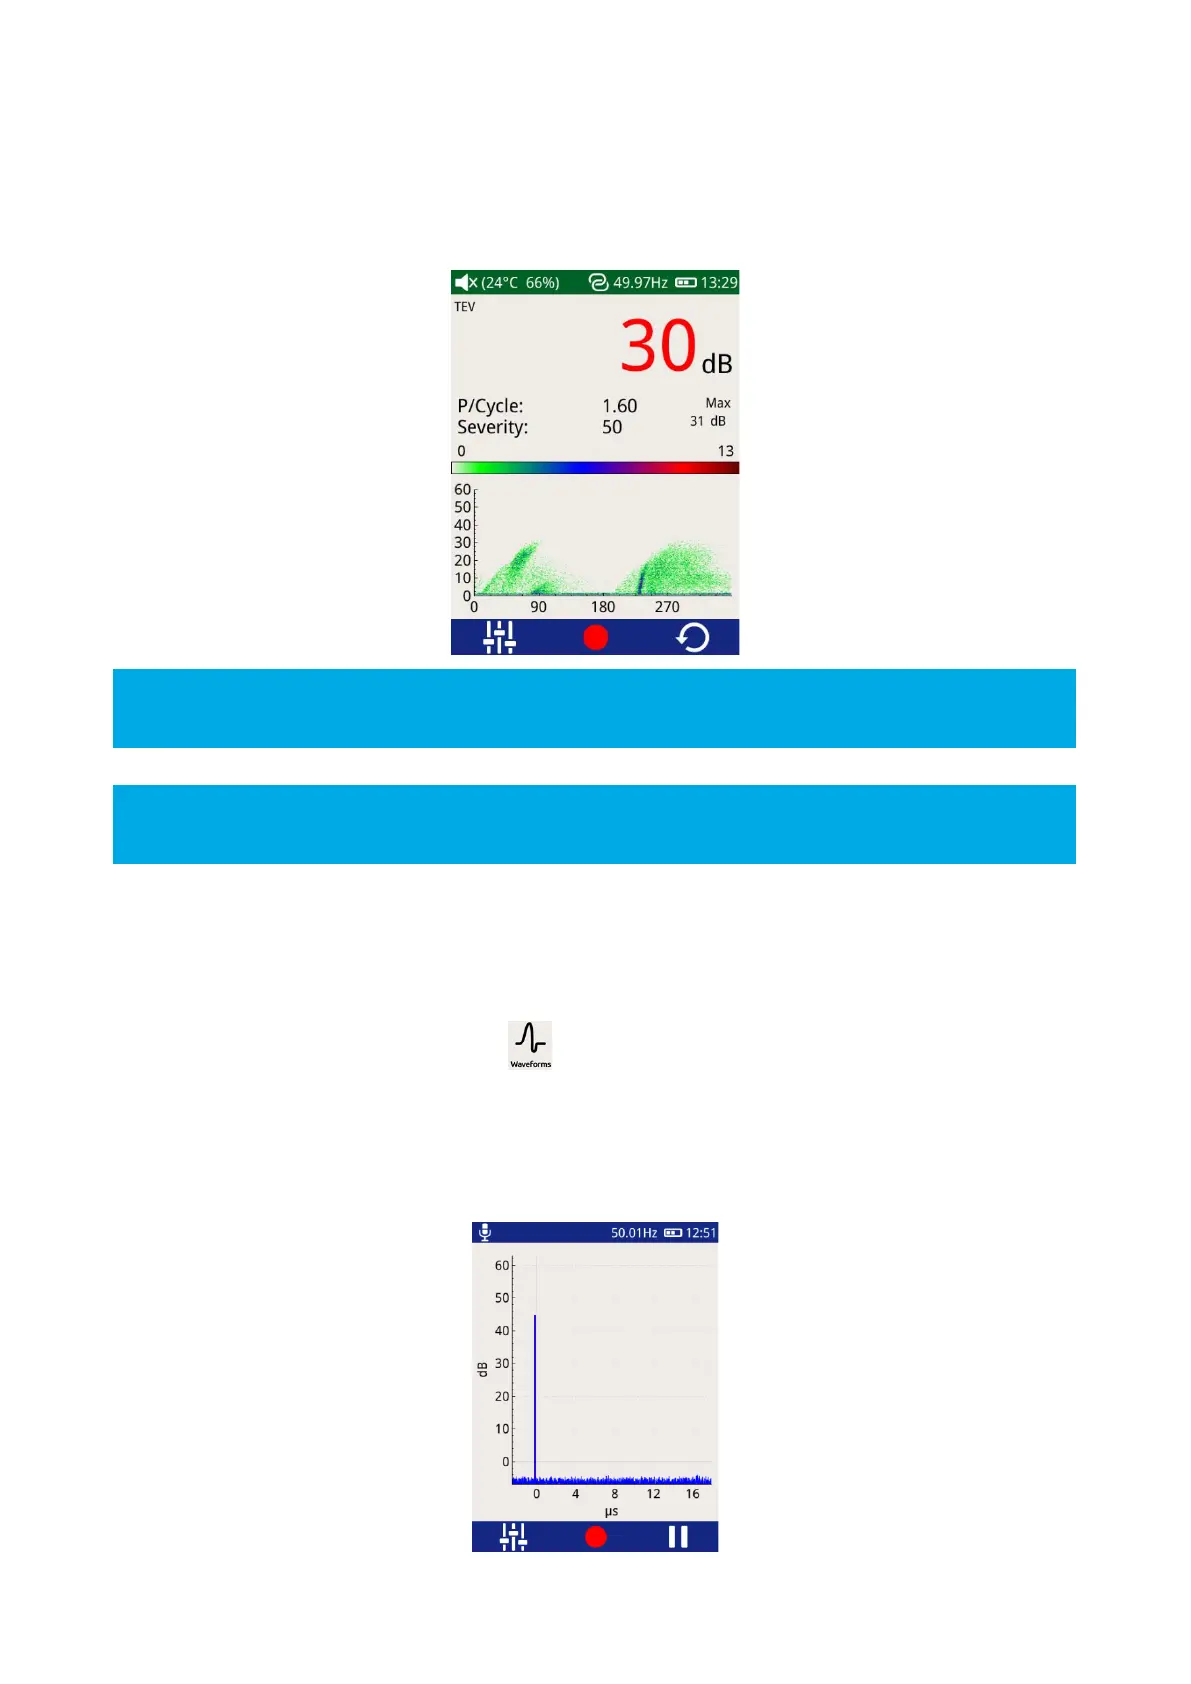
3.9.3 Waveform
The ‘Waveform’ mode is common to both TEV and Cable PD. When in Cable PD mode, values will be displayed
in mA, whilst in TEV mode they will be measured in dBmV as below.
To enter this mode, click the Waveform icon .
This mode displays a plot of a TEV or Cable PD activity as a function of time allowing an instantaneous view of
an activity’s amplitude with respect to time. This option can be used to assist in distinguishing between genuine
PD activity and noise. A Partial Discharge pulse will normally manifest as a sharp fast rising edge pulse whilst
noise is often slower and less repeatable.