2388-MANUL-V10.00.00-UTP2 Operating Manual
Page 10 of 74
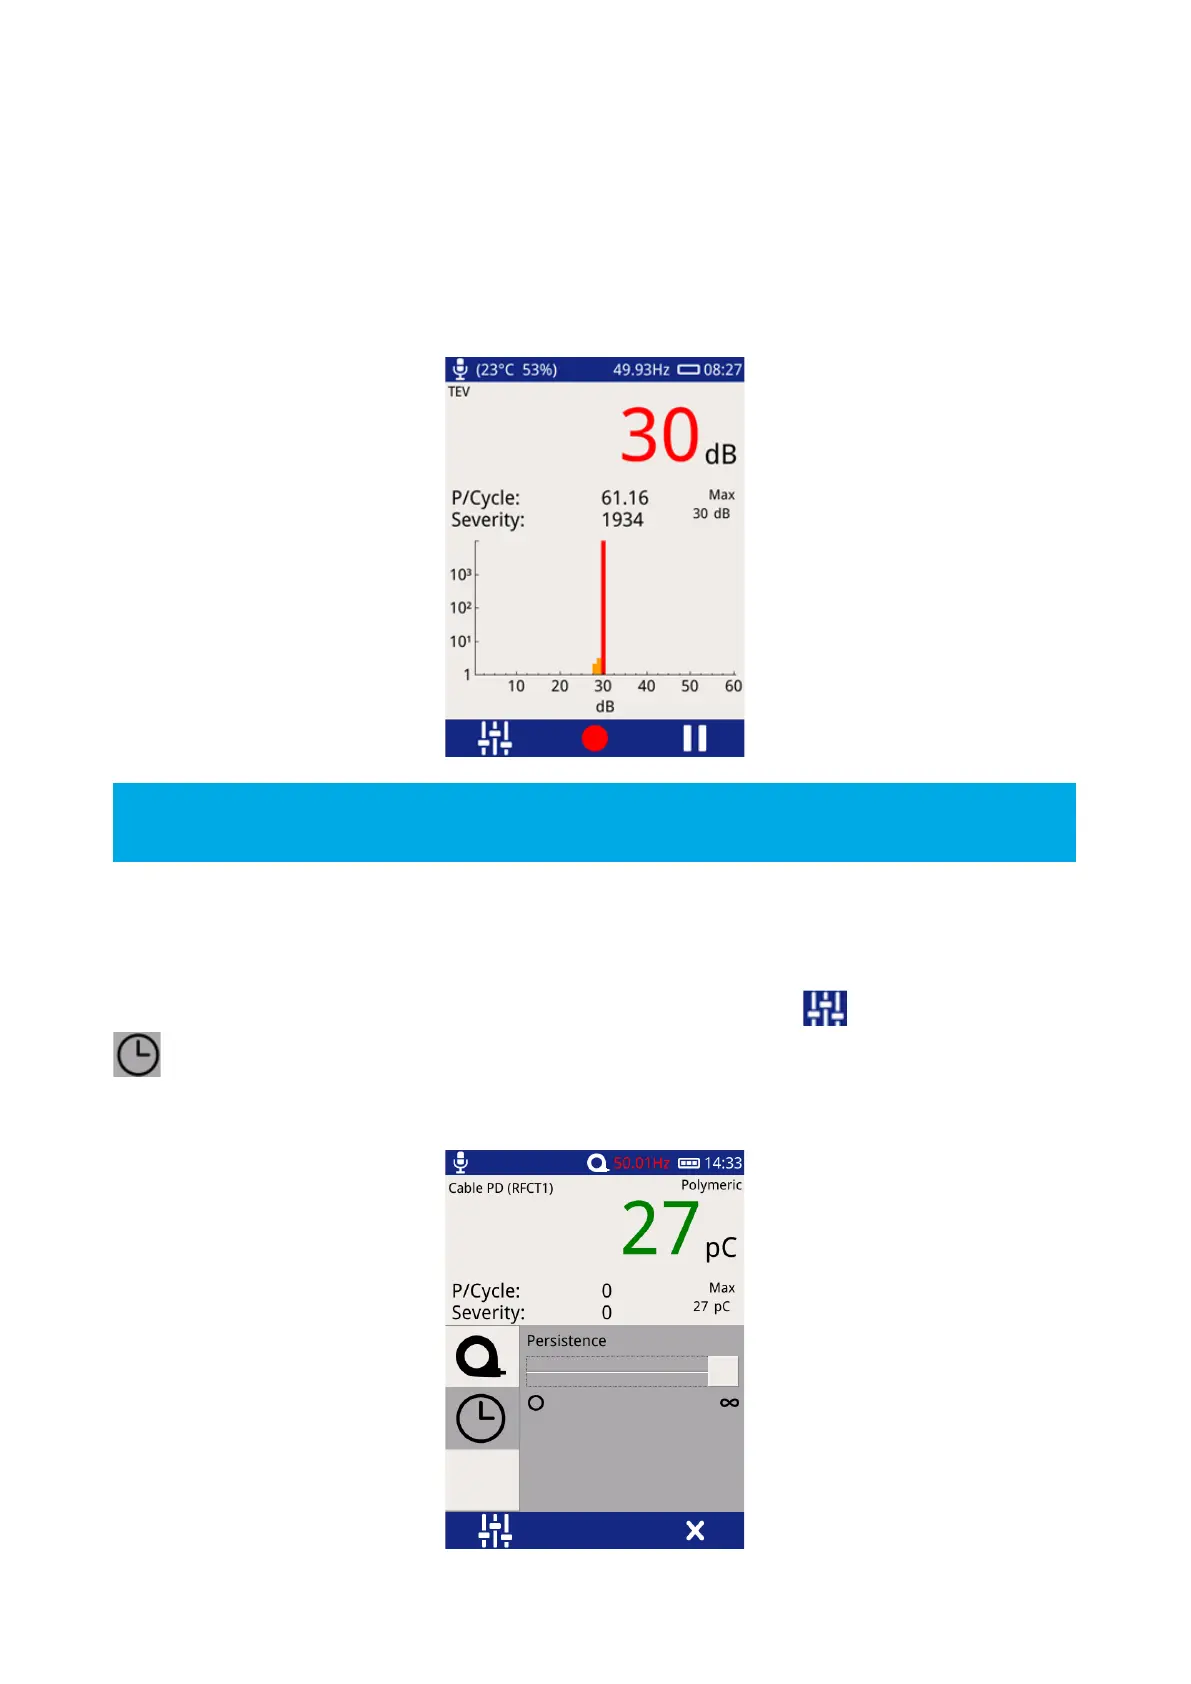
3.9.4 Histogram
This Histogram mode displays the number of events registered (y-axis) for a given amplitude (x-axis). This
measurement option is useful for determining if more than one discharge source is present; two distinct groups
of bars on this chart could mean there are two sources of discharge at the respective dB (or pC) levels. The
screen is also useful in positively identifying a genuine source of PD and assessing its pulse rate when there is
a high pulse rate noise floor affecting the standard pulse per cycle calculation.
The Pause and Record option is also available in this mode; Severity, and P/Cycle are calculated and as
described under the Measure Screen.
3.9.5 Persistence Mode
The Persistence mode is available in the Phase Plot and Amplitude Histogram screens for TEV, Cable PD and
UHF readings. To enter this mode from these screens, click the Settings icon until the Persistence icon
is displayed, then select it. To change the persistence level, move the slider between “0” (only recent pulses
are shown, older pulses fade out quickly) and “∞” (all pulses continue to be shown until the screen is manually
cleared).