2388-MANUL-V10.00.00-UTP2 Operating Manual
Page 13 of 74
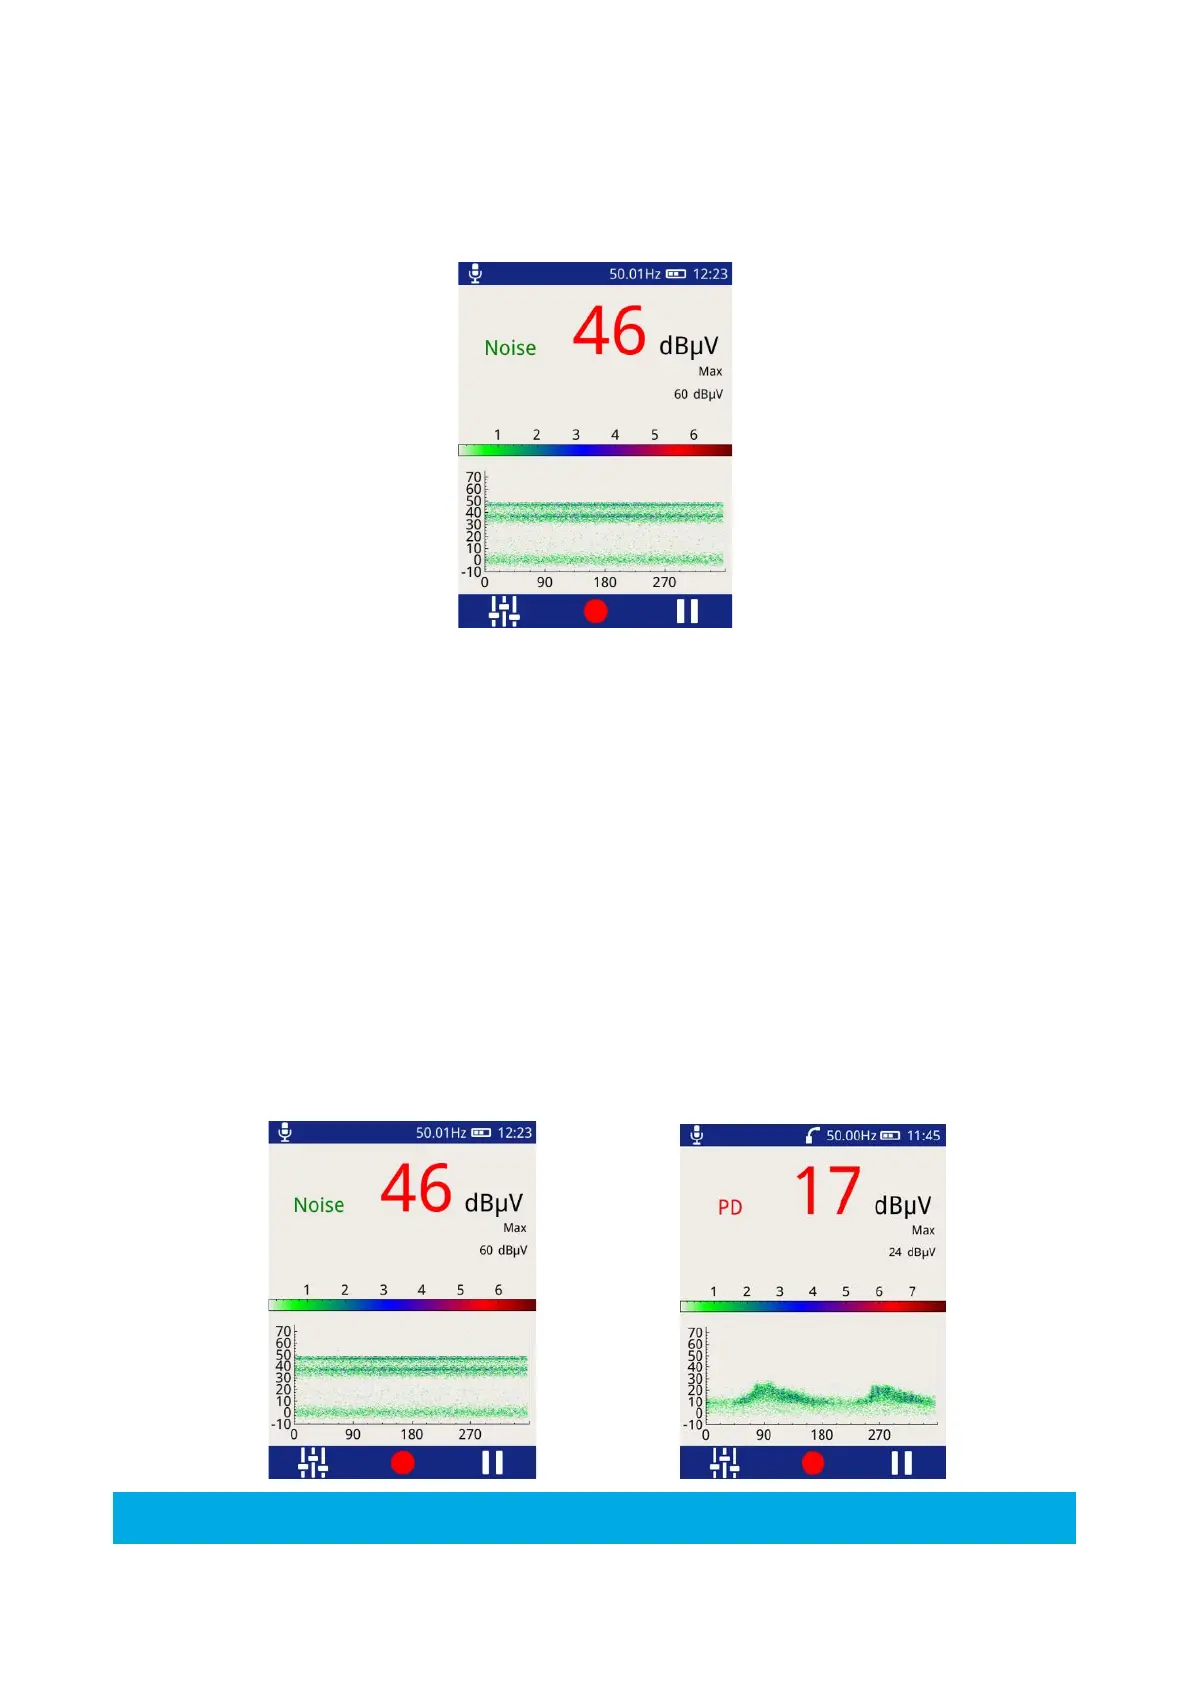
3.10.2 Ultrasonic Screen
The Ultrasonic screen shows measurements taken using either the inbuilt Ultrasonic sensor or the external
Ultrasonic sensors (Ultrasonic Contact Probe, Flexible Sensor or UltraDish) if connected.
Ultrasonic magnitude is measured in dBµV and is displayed on the chart as phase angle (x-axis) against
amplitude (y-axis). The colour chart represents a key to show the intensity (pulse count) at a given amplitude
and phase angle.
This phase resolved plot can be used to further confirm the presence of a partial discharge activity. In general
PD activity will be displayed as a stable area which will occur at the same to phase angle each cycle; whilst
noise tends to be out of phase and occurs at irregular positions on the phase plot.
3.10.3 Ultrasonic classification
The Ultrasonic display on the UTP2 includes the output of EA Technology’s proprietary ultrasonic classification
algorithm. The algorithm processes measured ultrasonic data in real time to give an indication whether the
input data is a background noise source or partial discharge activity.
The algorithm processes the data from the ultrasonic Microphone along with the phase reference signal, and
looks for patterns within the data stream which experts at EA Technology have identified as typical indicators
of partial discharge.