IL17569
Page 4-8
Effective June, 2001
Current Demand Window (Fixed Window)
Current Demand is the average of system current over time, which can
be set from 1 to 60 minutes. For example, if the range is set for 30
minutes, the FP-5000 calculates the average current over the past 30
minutes and updates the value every 30 minutes. The range can be
selected from the Logging menu by pressing the “Set” pushbutton.
Refer to Section 5 Settings of this manual for setting changes. The
default setting for Current Demand window selection is 15 minutes.
Power Demand Window (Fixed or Slide)
In addition to the interval setting as in the Current Demand Window,
the Power Demand window has an additional setting of Fixed or Slide
window. The default setting for Power window is Fixed. If Fixed
window is selected, the Demand will be calculated every fixed interval
and updated every fixed interval. If the Slide window is selected, the
Demand will be calculated every minute for the interval selected. For
example, if the Slide window is selected and the interval is set to 30
minutes, the FP-5000 calculates and updates the average power for
the past 30 minutes, every minute. Refer to Section 5 Settings of this
manual for setting changes.
The FP-5000 also saves the peak demand values for current and
power. The quantities represent the largest demand value since the
demand values were last reset. Peak demands for current and
system power are date and time stamped to the nearest second.
Current Peak Demand
IA Demand Magnitude
IB Demand Magnitude
IC Demand Magnitude
I Demand Last Reset
Date mm/dd/yy
Time hh:mm:ss
Power Demand
M Watt Magnitude
M Var Magnitude
M VA Magnitude
Power Peak Demand
M Watt Magnitude
M Var Magnitude
M VA Magnitude
P Demand Last Reset
Date mm/dd/yy
Time hh:mm:ss
Current Demand
IA Demand Magnitude
IB Demand Magnitude
IC Demand Magnitude
• Power Distribution (Figures 4.4 and 4.6)
Three conditions are typically encountered when monitoring power
distribution systems as follows:
1. Circuit breakers A and B are closed and C is open.
Power flow is in Quadrant 4. The power factor and Vars
are positive.
2. Circuit breakers A and C are closed and B is open.
Power flow for breakers A and C is in Quadrant 4. The
power factor and Vars are positive.
3. Circuit breakers B and C are closed and A is open. The
power flow for breaker B is in Quadrant 4 and the
metering conditions are the same as conditions 1 and 2.
However, the power flow for breaker C is reversed and
is in Quadrant 2.
The display units for Energy may be set to either kilo units or Mega
units. The “Energy Unit” setting is changed in the “System Configu-
ration” setting menu in the “Set” mode. The screen displays a 9-digit
energy reading. Energy values roll over from 999,999,999 to 0.
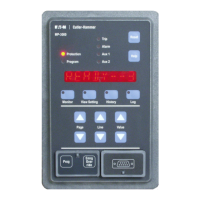
4.6.1.4 Selecting the “Demand” Sub-menu
This menu allows the user to view the following Demand parameters
(See Display 4.7).
• Current Demand (IA, IB, IC)
• Current Peak Demand (IA, IB, IC)
• Date and Time Stamp when Current Demand was last reset
• Power Demand (Watt, Var, VA)
• Power Peak Demand (Watt, Var, VA)
• Date and Time Stamp when Power Demand was last reset
Figure 4-5. Induction Motor Load
Figure 4-6. Power Distribution
Display 4.7 Demand Sub-menu
 Loading...