SD Series Dry Cabinets Setup and Operation Manual | A62-3337-00 Rev: 1.0.0 Page 70
9.5 GRAPH
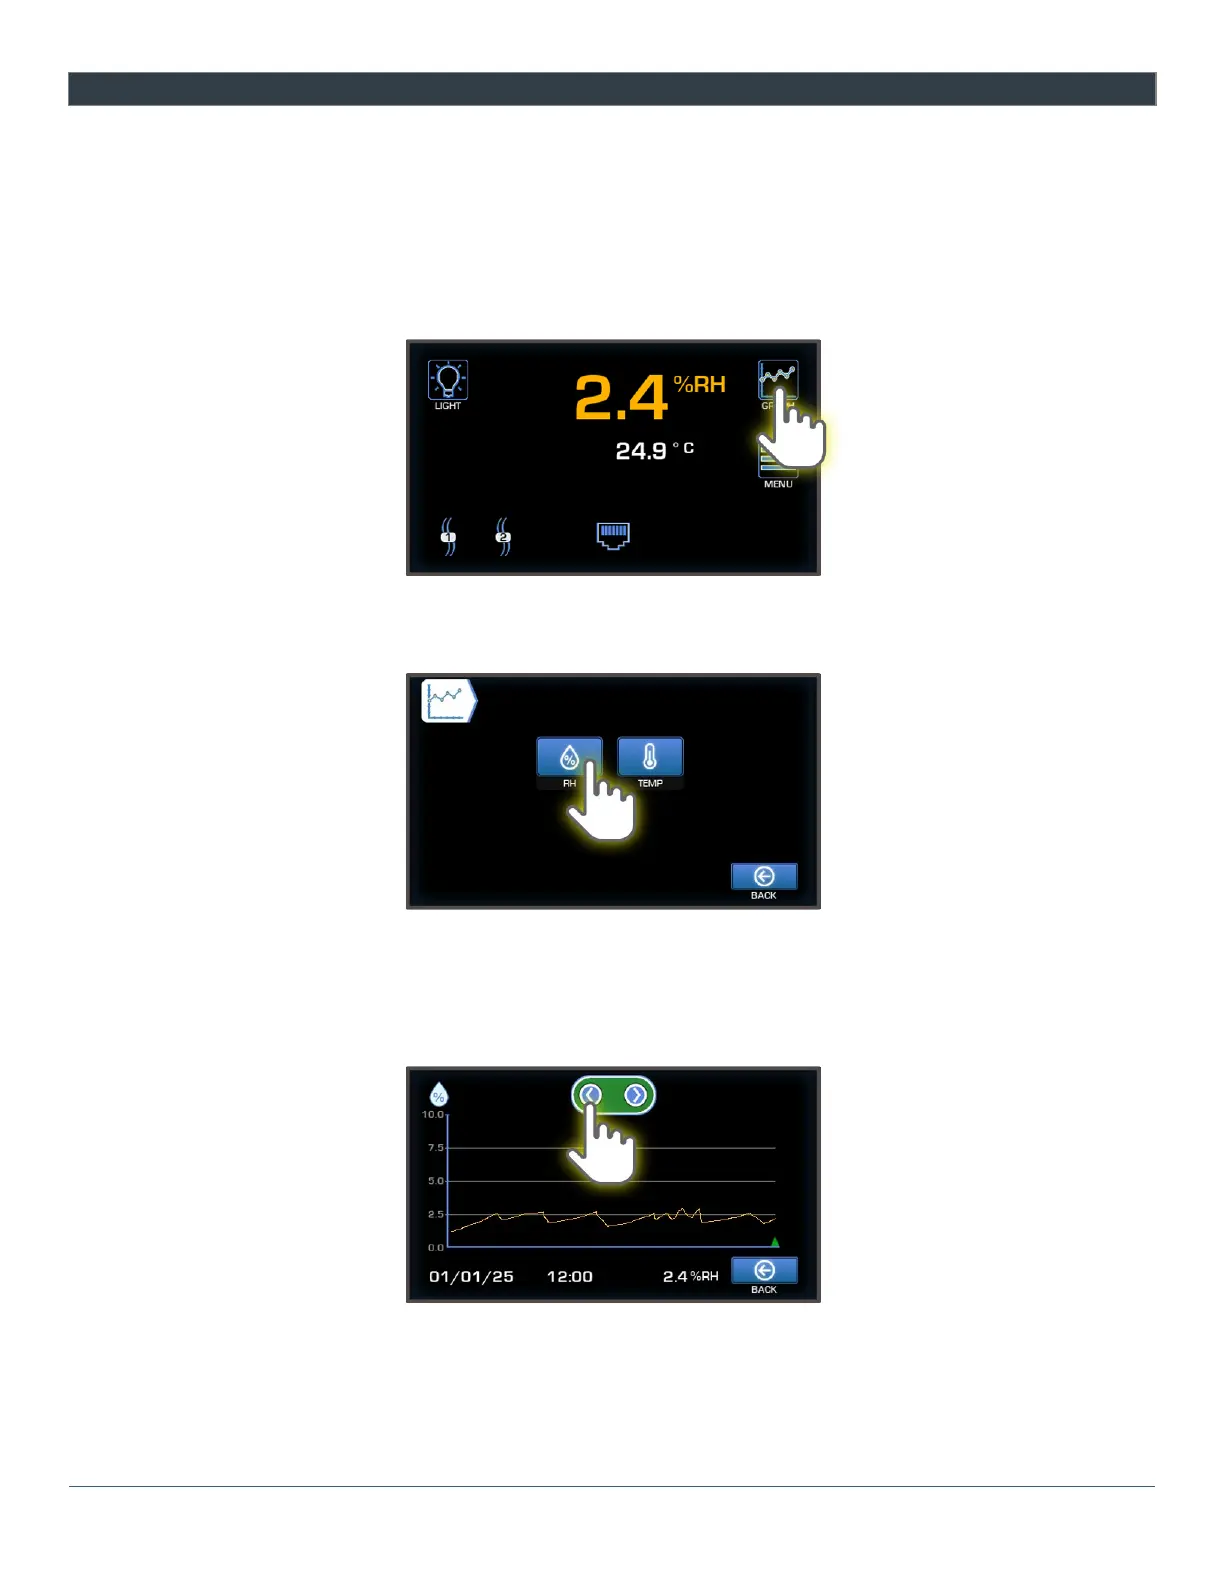
The Graph allows you to see the recorded measurements of either RH or Temperature in graphical form.
To view a graph:
1) From the Main Display, enter the Graph menu by pressing the Graph button. Press the desired graph
type.
2) Press the Left or Right button to scroll the graph forward or backward in time.
3) To exit the screen, select the Back button which takes you “Back” to the previous menu.