lower temperature air makes it feel “colder” and this is reflected in the wind
chill temperature. Conversely, if it feels warmer than the measured air
temperature due to the effects of humidity, we use a heat-index temperature to
indicate how warm it feels.
The “dew point” is not a perceptual value, but it is calculated from the sensor
values (temperature and humidity). The dew point is the temperature to which
air has to be cooled to become saturated, and beyond which airborne water
vapor would become liquid (dew).
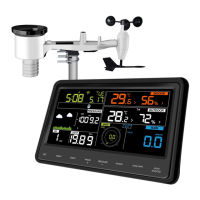
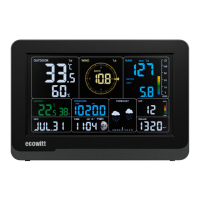
5.1.2 Rain data
The normal mode has a segment for displaying rainfall related data. Press the
RAIN/+ button to alternate the display between:
• Rain rate: amount of rainfall accumulated in the past 60 minutes
• Rain day: amount of rainfall accumulated since midnight
• Rain week: amount of rainfall accumulated since the start of the week.
The week starts when Sunday begins and ends exactly 7 days later
• Rain month: amount of rainfall accumulated since the start of the current
month
• Rain year: amount of rainfall accumulated since the start of the year
5.1.3 Graphed data
The normal mode has an area that displays a graph of historical data. The
graph will span a period of 12, 24, 48 or 72 hr. This is controlled from a setup
menu (see section 5.2.6). Press the GRAPH button to alternate the displayed
graph between:
• Indoor and outdoor temperature
• “Feels Like” temperature and dew point temperature
• Indoor and outdoor humidity
• Absolute (ABS) and Relative (REL) barometric pressure
• Wind speed and gust speed
• UV-index
• Solar Radiation (Light)