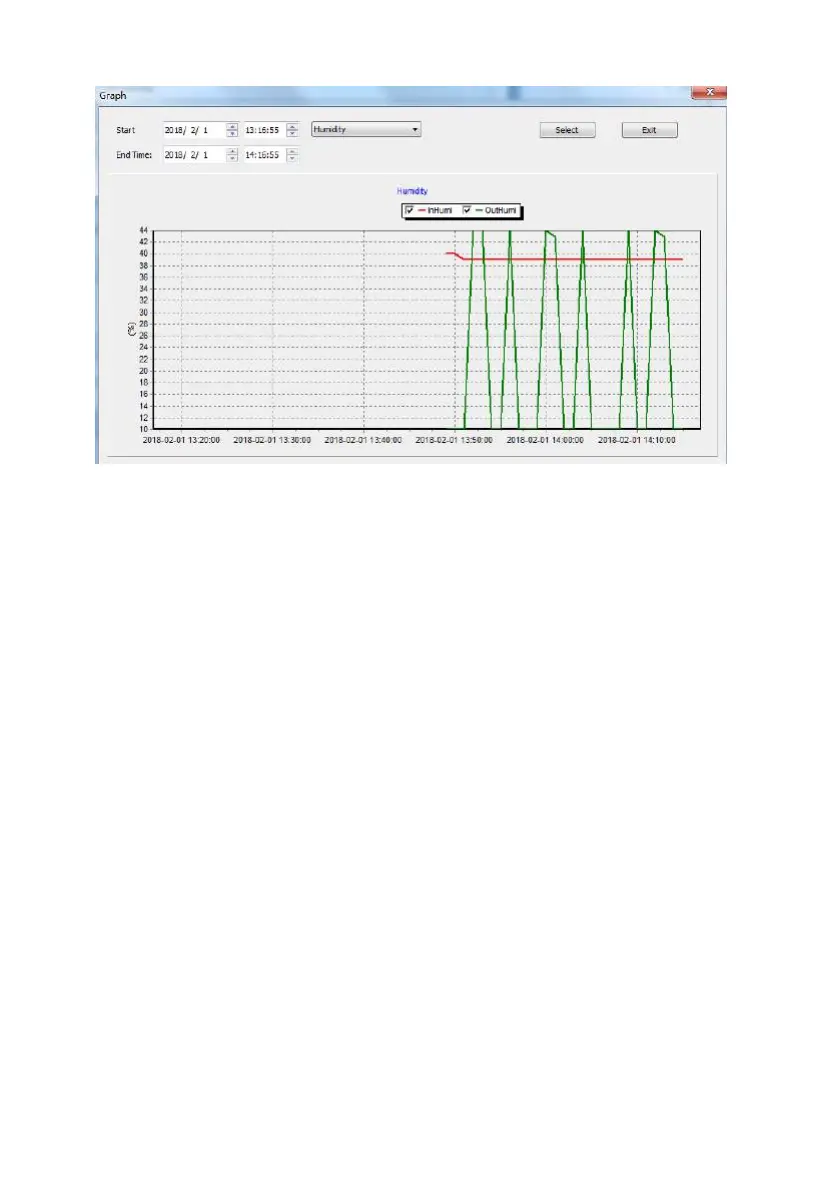
Figure: Graph screen
After displaying data from a particular file, you can press the “Graph” button
to see the data in graphical format. The Graph screen will come up, but a
graph will not yet be drawn. You first must select that time range in “Start”
and “End Time” and then press “Select”. You can also use the pop-up menu to
the right of start and end-time to determine what kind of data will be graphed.