Diagnostics and troubleshooting Deltabar PMD78B PROFINET with Ethernet-APL
74 Endress+Hauser
11.7 Event logbook
11.7.1 Event history
The Event list submenu provides a chronological overview of the event messages that
have occurred
3)
.
Navigation path
Diagnostics → Event logbook
A maximum of 100 event messages can be displayed in chronological order.
The event history includes entries for:
• Diagnostic events
• Information events
In addition to the operating time when the event occurred, each event is also assigned a
symbol that indicates whether the event has occurred or is finished:
• Diagnostic event
• : Occurrence of the event
• : End of the event
• Information event
: Occurrence of the event
11.7.2 Filtering the event logbook
Filters can be used to determine which category of event messages is displayed in the
Event list submenu.
Navigation path
Diagnostics → Event logbook
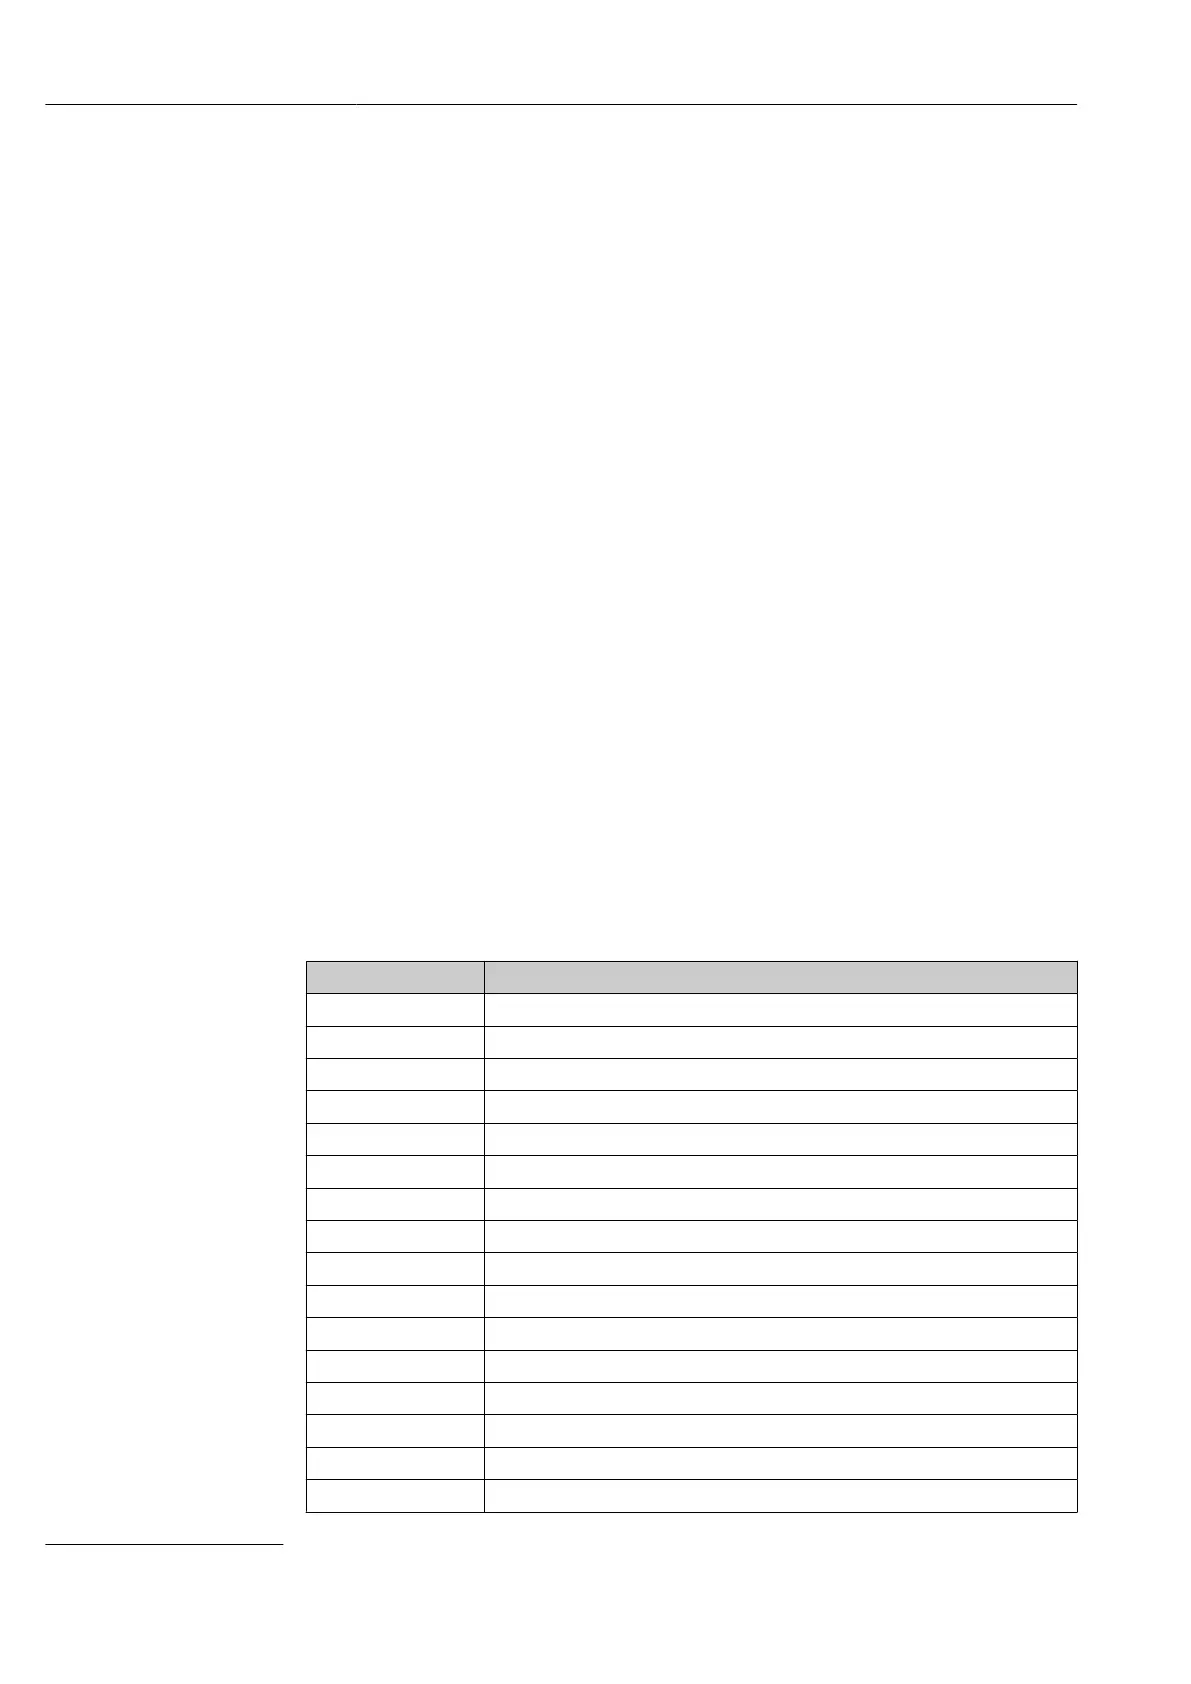
11.7.3 Overview of information events
Info number Info name
I1000 --------(Device ok)
I1079 Sensor changed
I1089 Power on
I1090 Configuration reset
I1091 Configuration changed
I11036 Date/time set successfully
I11074 Device verification active
I1110 Write protection switch changed
I1151 History reset
I1154 Reset terminal voltage min/max
I1155 Reset electronics temperature
I1157 Memory error event list
I1256 Display: access status changed
I1264 Safety sequence aborted
I1335 Firmware changed
I1397 Fieldbus: access status changed
3) If operating via FieldCare, the event list can be displayed with the "Event List/HistoROM" function in FieldCare.
 Loading...