MMS6110Directionforuse
Visualization Page24
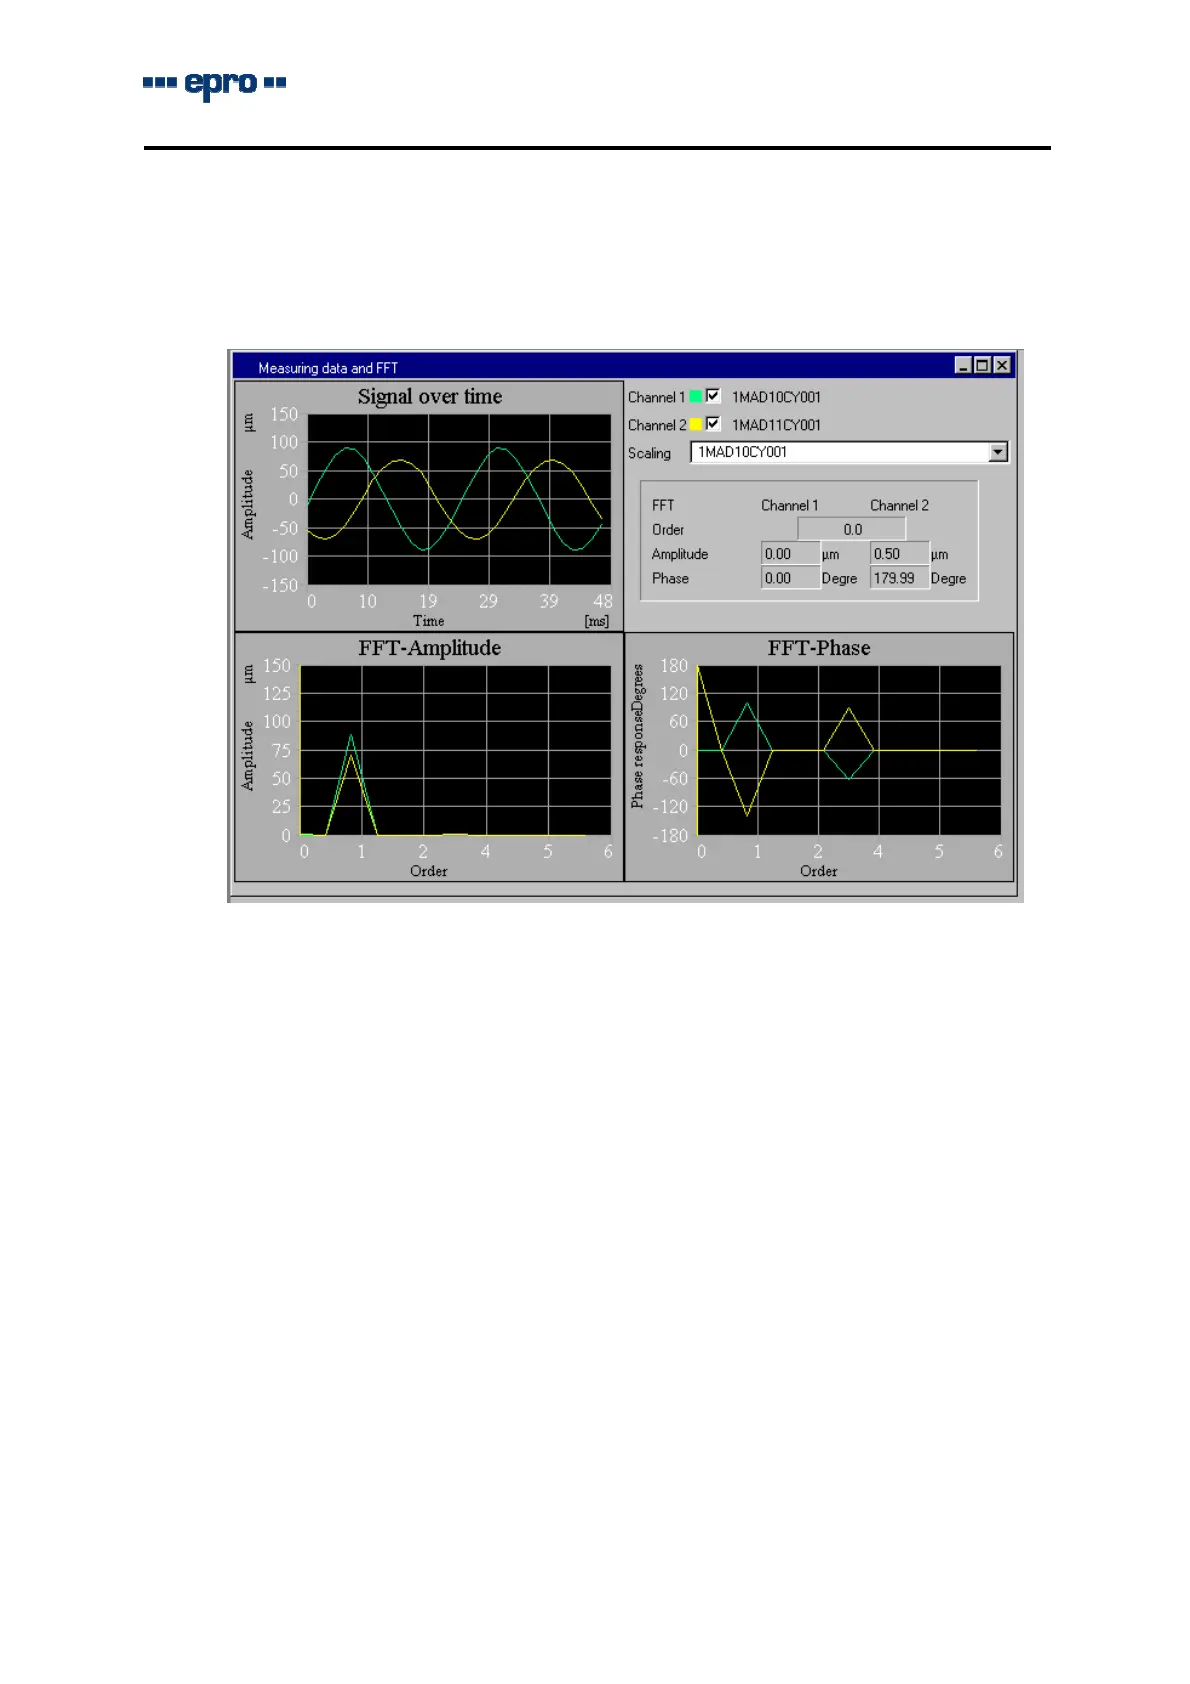
3.4 MeasuringDataandFFT
DisplayfunctionMeas.datashowsonthreedisplaypanelstheamplituderesponseina
trenddiagramandthespectrumanalysisasfrequency(FFT)ororderanalysisofamplitude
andrelativephase.
Thesignalanalysisofbothchannelsisstartedbycallingupthisdialog.Thethreedisplays
showthecurvesforchannel1ingreenandforchannel2inyellow(defaultsetting,menuOp-
tions>Program>Configuration>Colors).
Parameterswitchchannel1andchannel2
Theseswitchesactivatethedisplayfunctionsforbothchannels.
ListScaling
Inthedualchannelmodeselection"Scaling"servesthemodificationofthedisplayscalingif
thechannelshavebeenconfigureddifferently.
DisplaypanelTimefunction
Thetimefunctionshowstheamplitudesofthedynamicsignalforthetwochannelsarounda
symmetricalcenterline.Thescalingofthetimeaxisdependsonthemodechoseninprop-
ertypageDataacquisition.
• Havingchosenthespeedcontrolledmode,theprogramdistinguishesbetweenthesta-
tionaryandinstationaryrangeandspeedsoutsideofthem.Inthestationaryandinstation-
aryrangethetimeaxiscorrespondstoonemeasuringcycle.i.e.theindicatednumberof
revolutionscorrespondstothesettingrevolutionspercycle(propertypageDataacqui-
sition).Outsidetheinstationaryandstationaryrangesdataacquisitionandvisualization