4342
5.2.2 Viewing Log Graphs
Perform the following steps to view the Log graphs.
1. Ensure that you have completed the steps described in
section 5, Roadside Inspection.
2. Tap the Display button. The Info tab displays
by default.
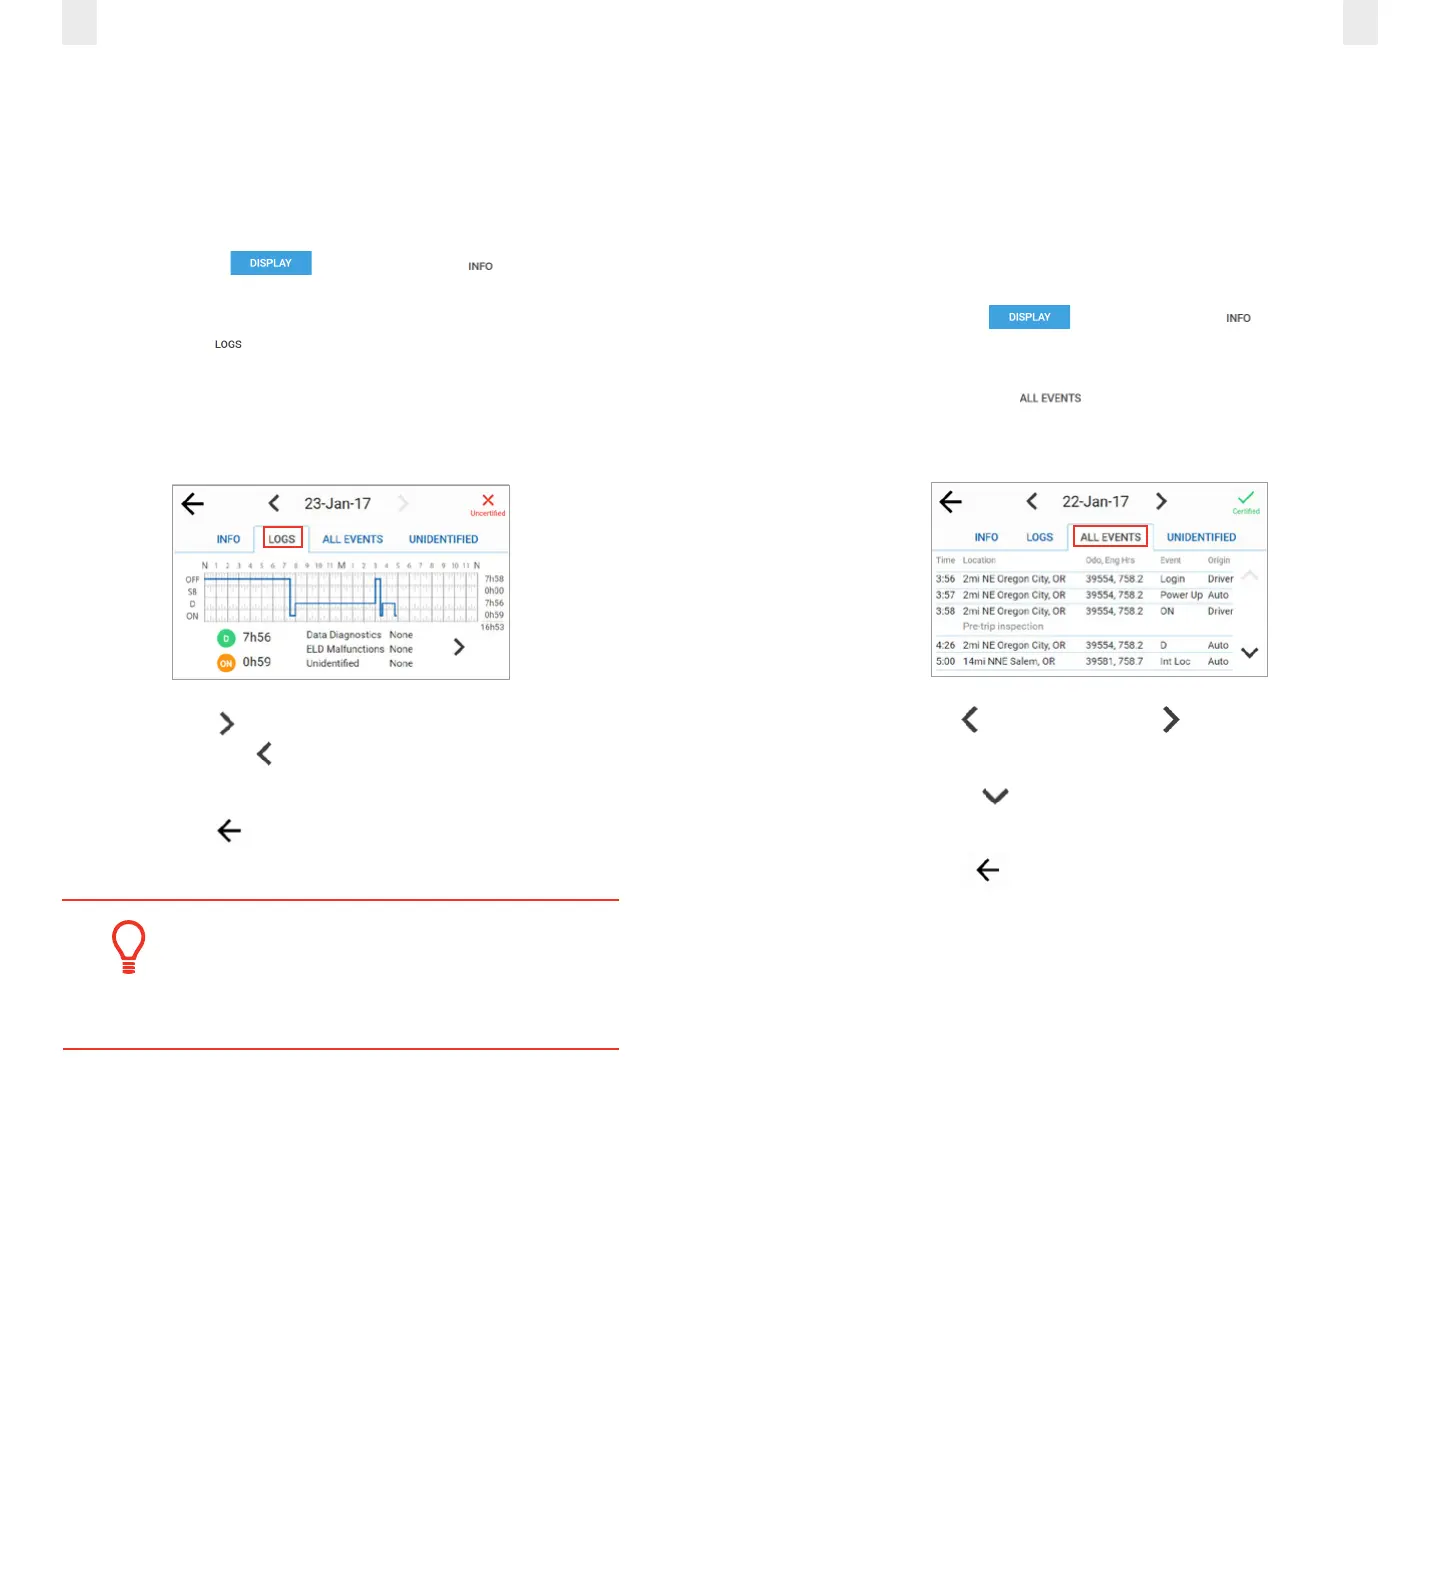
3. Tap the Logs tab. The log graph illustrates your logs for
the last eight days, listing total hours for each duty status.
It displays hours while driving, on-duty, Data Diagnostics
status, Unidentified hours’ status, and if there are any ELD
Malfunctions.
4. Tap the Right arrow to see driver status changes in the
log or tap the Left arrow to return to the first (Logs) tab
screen. The inspector can see details for each duty status.
5. Tap the Back arrow in the upper left corner of the
screen to return to the previous screen.
Tip:
The inspector can navigate through the logs for the
last eight days by tapping the left or right arrows
next to the date at the top of the screen.
5.2.3 Viewing All Events
The All Events tab displays a list that includes: event time,
location, odometer reading, engine, hours, event type, and
origin. Perform the following steps to view the All Events tab.
1. Ensure that you have completed the steps described in
section 5, Roadside Inspection.
2. Tap the Display button. The Info tab displays
by default.
3. Tap the All Events tab. All the events recorded
by the device are displayed, such as login, change in duty
status, etc. Malfunctions, if any, are displayed under this tab.
4. Tap the Left arrow or the Right arrow to change the
date.
5. Tap the Down arrow to scroll through the events for
the specified date.
6. Tap the Back arrow in the upper left corner of the
screen to return to the previous screen.