inserted into the product. Once the Product Probe is inserted into the product, the
control will recognize it and start the programmed cycle.
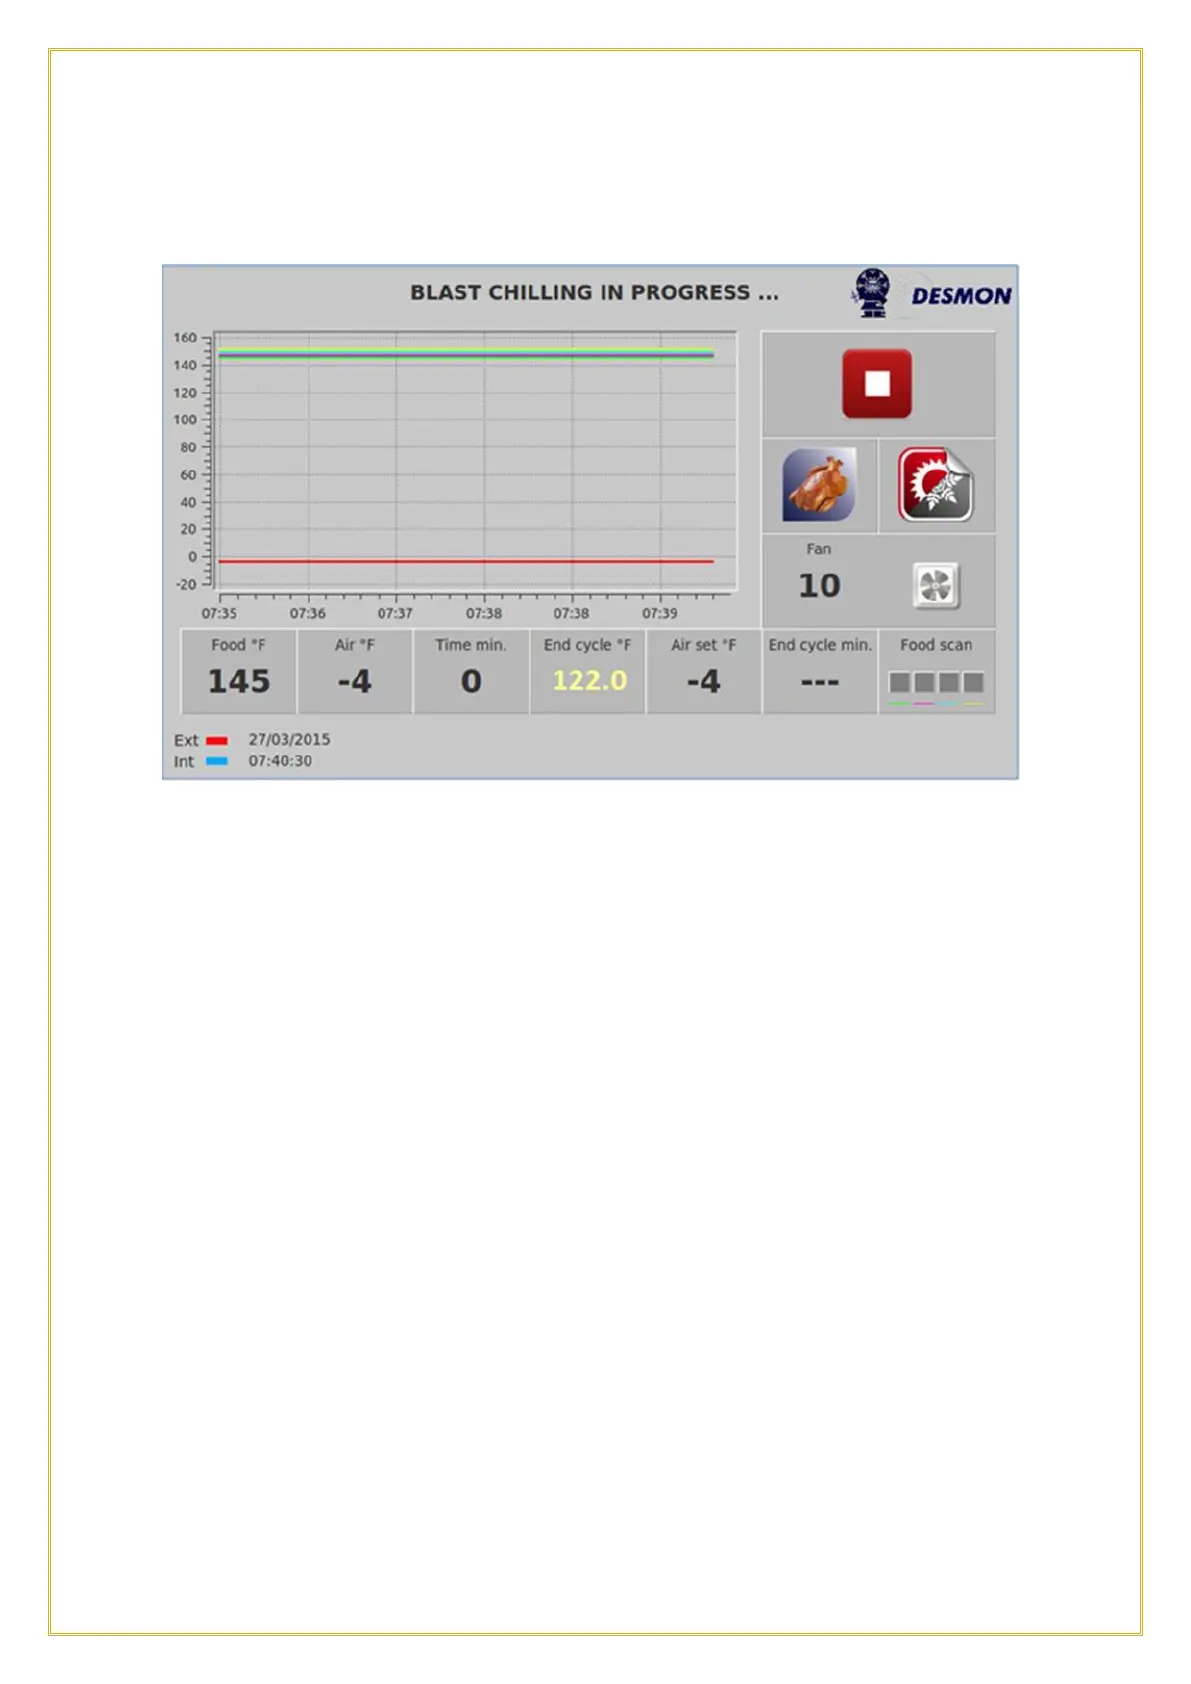
A graph will show in real time the product core temperatures read by the Product Probe
and the Air temperature of the cavity. On the right side it will show the Stop icon (Red
Square), actual product type, the type of cycle (Chilling or Freezing icon), and the Fan
Speed. On the bottom the screen will show real time probe values as well as cycle set
point values. From left to right:
➢
Food – The real product core temperature.
➢
Air – The real air temperature in the cavity.
➢
Time - Elapsed time in minutes the cycle has been running.
➢
End Cycle Temperature - In an automatic recipe this is the first step of the product
core temperature target. Once this temperature is reached in the product core, the
cycle will switch to next step.
➢
Air set - The cavity air temperature of the current step.
➢
End cycle - The time to the end of the cycle (shown here three dashes because it’s
a core temperature based cycle, so it’s unable to calculate the cycle length)
➢
Food scan - The status of the multi-point Product Probe temperatures, the left
square is related to the sensor on the point of the probe, the right square is related
to the sensor closest to the handle.
The system will perform a “food scan” by monitoring the 4 sensors of the Product
Probe inserted into the product within the first 5 minutes. Some of them may be
excluded from the algorithm, because they are not in the product. The warmest sensor in
the Product Probe will determine the end of the total cycle 38°F (3°C). Each sensor in