Instruction Manual
D102748X012
Configuration
October 2014
44
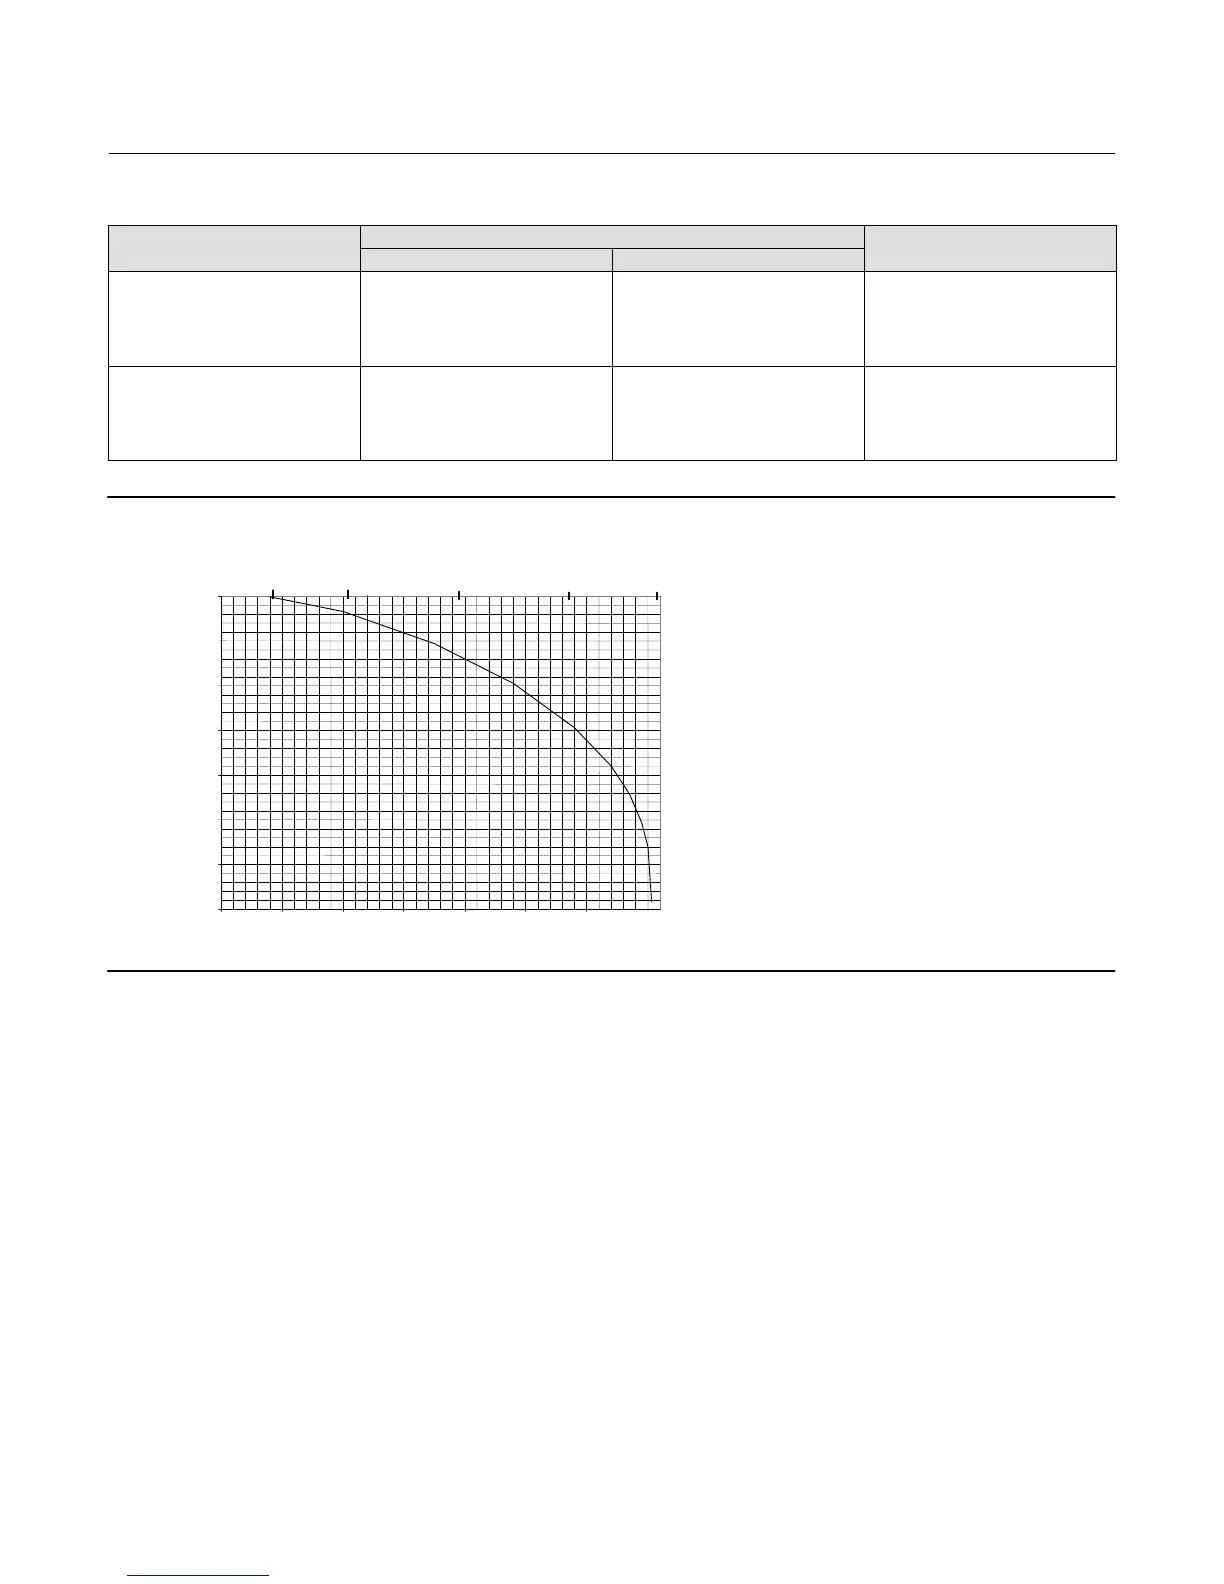
Table 4‐2. Example Specific Gravity vs Temperature Table for Saturated Water
Data Point
Temperature
Specific Gravity
_C _F
1
2
3
4
5
26.7
93.3
176.7
248.9
304.4
80.0
200.0
350.0
480.0
580.0
0.9985
0.9655
0.8935
0.8040
0.7057
6
7
8
9
10
337.8
354.4
365.6
371.1
374.7
640.0
670.0
690.0
700.0
706.5
0.6197
0.5570
0.4940
0.4390
0.3157
Figure 4‐4. Example Saturated Water Curve Plotted with Values from Table 4‐2
0.3
0.4
0.5
0.6
0.7
0.8
0.9
1.0
0 100 200 300 400 500 600 700
TEMPERATURE _F
SPECIFIC GRAVITY
100 200 300-18 30 380
TEMPERATURE _C
E0369
You can enter up to 10 temperature and specific gravity pairs in the table. The table entry function is terminated by
entering zero for the specific gravity. Keep this in mind when setting up a table for a upper fluid, such as steam, whose
specific gravity approaches 0 at lower temperatures.
The resolution of the table entry for specific gravity is 5 decimal places. This means the smallest specific gravity value
you can enter is 0.00001, which should be sufficient to allow a starting temperature around 15.6 _C (60 _F) for the
steam specific gravity table.
The example set of tables given are generated by visually laying linear segments over a reference curve, and are not
guaranteed to provide any particular accuracy. They are provided to illustrate the guidelines for developing your own
table.
1. Establish a table for the fluid(s) you are using over the expected operating range of process temperature. This
allows you to make best use of the maximum of ten points to obtain the accuracy you require. If your fluid specific
gravity is very linear over the operating temperature range, two data points may be sufficient. (The correction
algorithm provides linear interpolation between data points, and bounds the result at the table end points.)
2. Pick points closer together in regions of higher slope.
3. Pick linear segments that distribute the error equally on each side of the true curve.
Enter or display the specific gravity, or enter values in the specific gravity tables. The Field Communicator prompts for
either a single value for specific gravity or a table of specific gravity versus temperature. To enter a single specific
 Loading...