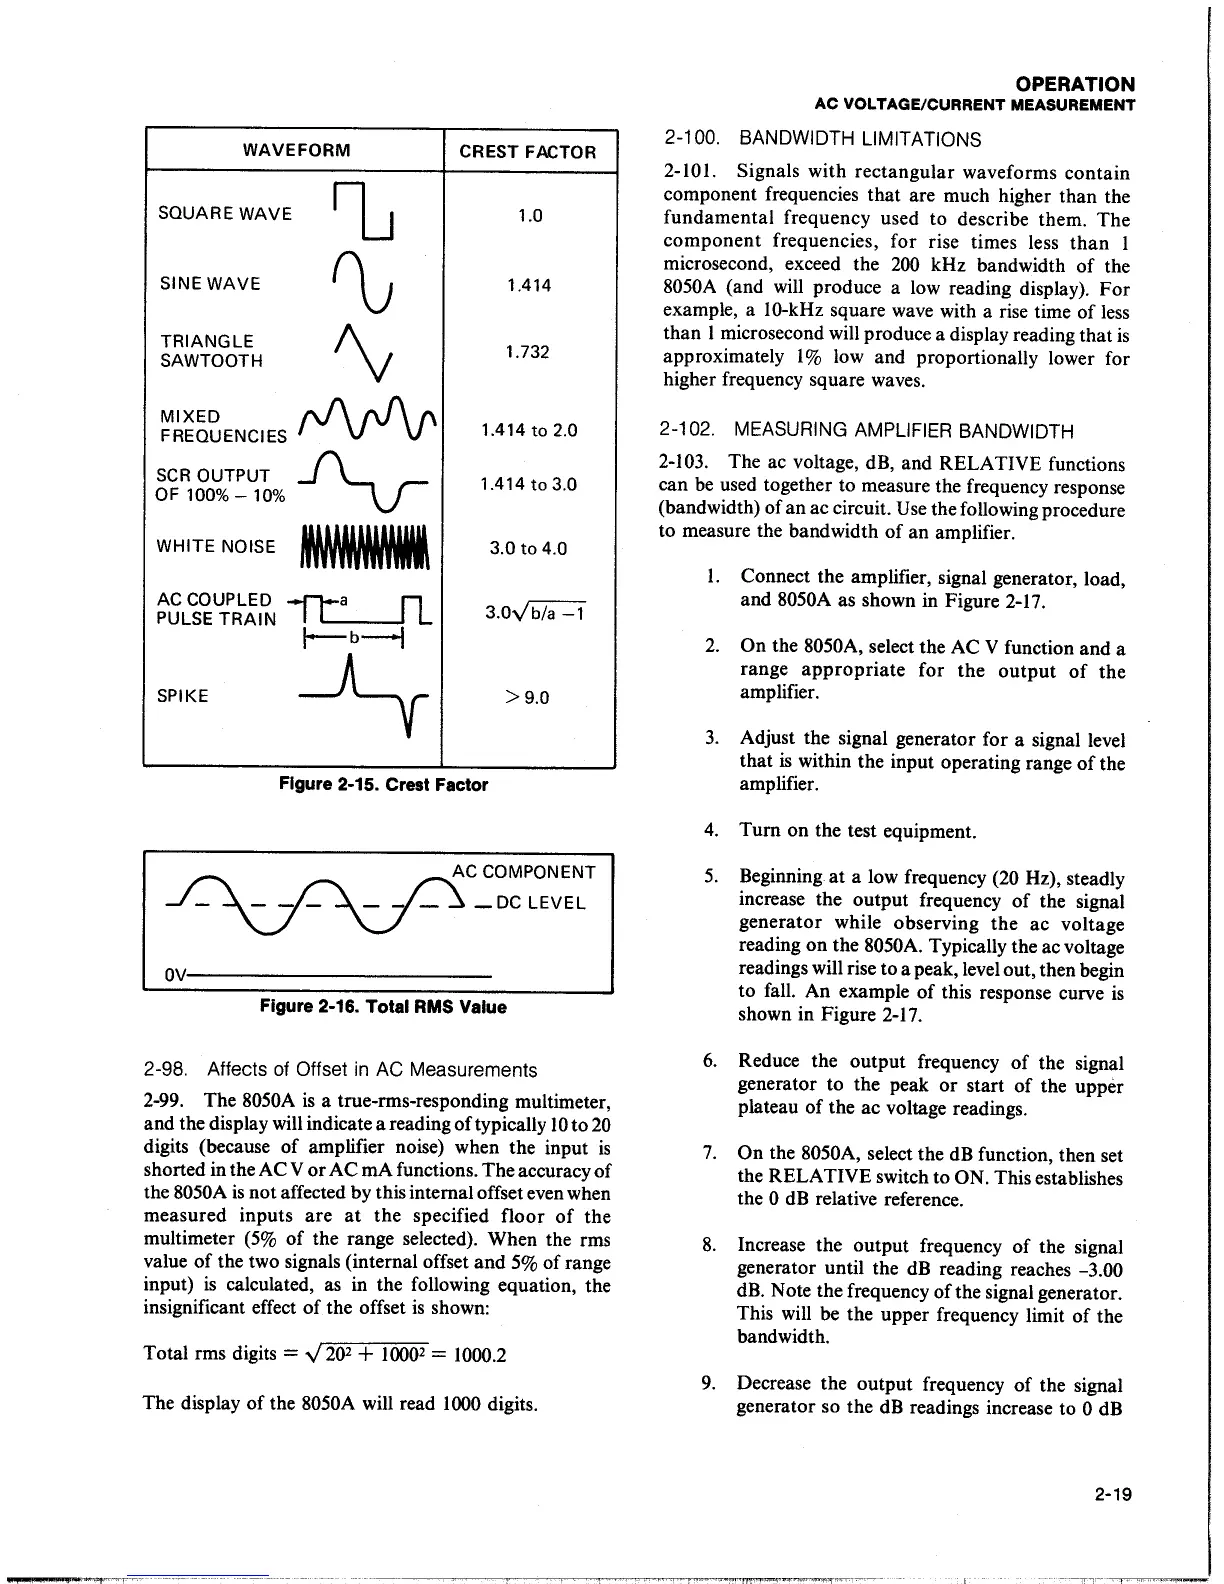
WAVEFORM
CREST FACTOR
SQUARE
WAVE
IL
1.0
SINE
WAVE
~
1.414
TRIANGLE
"v
1.732
SAWTOOTH
MIXED
~
FREQUENCIES
1.414to2.0
SCR
OUTPUT
~
1.414
to
3.0
OF
100%-
10%
WHITE NOISE
tNNB
3.0
to
4.0
ACCOUPLED
~
PULSE
TRAIN
l--b-I
3.0~
SPIKE
~
>9.0
Figure 2-15. Crest Factor
AC COMPONENT
_oc
LEVEL
Figure 2-16.
Total RMS Value
2-98. Affects
of
Offset
in
AC Measurements
2-99. The
8050A
is
a true-rms-responding multimeter,
and the display will indicate a reading
of
typically
IO
to
20
digits (because
of
amplifier noise) when the input
is
shorted in the AC
V
or
AC mA functions. The accuracy
of
the
8050A
is
not affected by this internal offset even when
measured inputs
are
at
the specified floor
of
the
multimeter
(5%
of
the range selected). When the rms
value
of
the two signals (internal offset
and
5%
of range
input)
is
calculated,
as
in the following equation, the
insignificant effect
of
the offset
is
shown:
Total rms digits
=
y
20
2
+
10002
=
1000.2
The display
of
the
8050A will read
1000
digits.
OPERATION
AC VOLTAGE/CURRENT MEASUREMENT
2-100. BANDWIDTH LIMITATIONS
2-101.
Signals with rectangular waveforms contain
component frequencies that are much higher than the
fundamental frequency used to describe them. The
component frequencies, for rise times less
than
1
microsecond, exceed the
200
kHz bandwidth
of
the
8050A
(and
will
produce a low reading display).
For
example, a
10-kHz
square wave with a rise time
of
less
than 1 microsecond will produce a display reading that
is
approximately 1 % low and proportionally lower for
higher frequency square waves.
2-102. MEASURING AMPLIFIER BANDWIDTH
2-103.
The ac voltage, dB, and RELATIVE functions
can
be
used together to measure the frequency response
(bandwidth) of an ac circuit.
Use
the following procedure
to measure the bandwidth
of
an amplifier.
I.
Connect the amplifier, signal generator, load,
and
8050A
as shown in Figure 2-17.
2.
On
the
8050A,
select the AC V
function and a
range
appropriate
for the
output
of
the
amplifier.
3.
Adjust the signal generator for a signal level
that
is
within the input operating range
of
the
amplifier.
4.
Tum
on the test equipment.
5.
Beginning
at
a low frequency
(20
Hz), steadly
increase the output frequency
of
the signal
generator while observing the ac voltage
reading on the
8050A.
Typically the ac voltage
readings will rise to a peak, level out, then begin
to fall. An example
of
this response curve
is
shown in Figure
2-17.
6.
Reduce the output frequency
of
the signal
generator to the peak
or
start
of
the upper
plateau of the ac voltage readings.
7.
On
the 8050A,
select the
dB
function, then set
the RELATIVE switch to
ON.
This establishes
the
0
dB
relative reference.
8.
Increase the output frequency
of
the signal
generator until the
dB
reading reaches
-3.00
dB.
Note the frequency
of
the signal generator.
This
will
be the upper frequency limit
of
the
bandwidth.
9.
Decrease the output frequency
of
the signal
generator so the
dB
readings increase to 0
dB
2-19