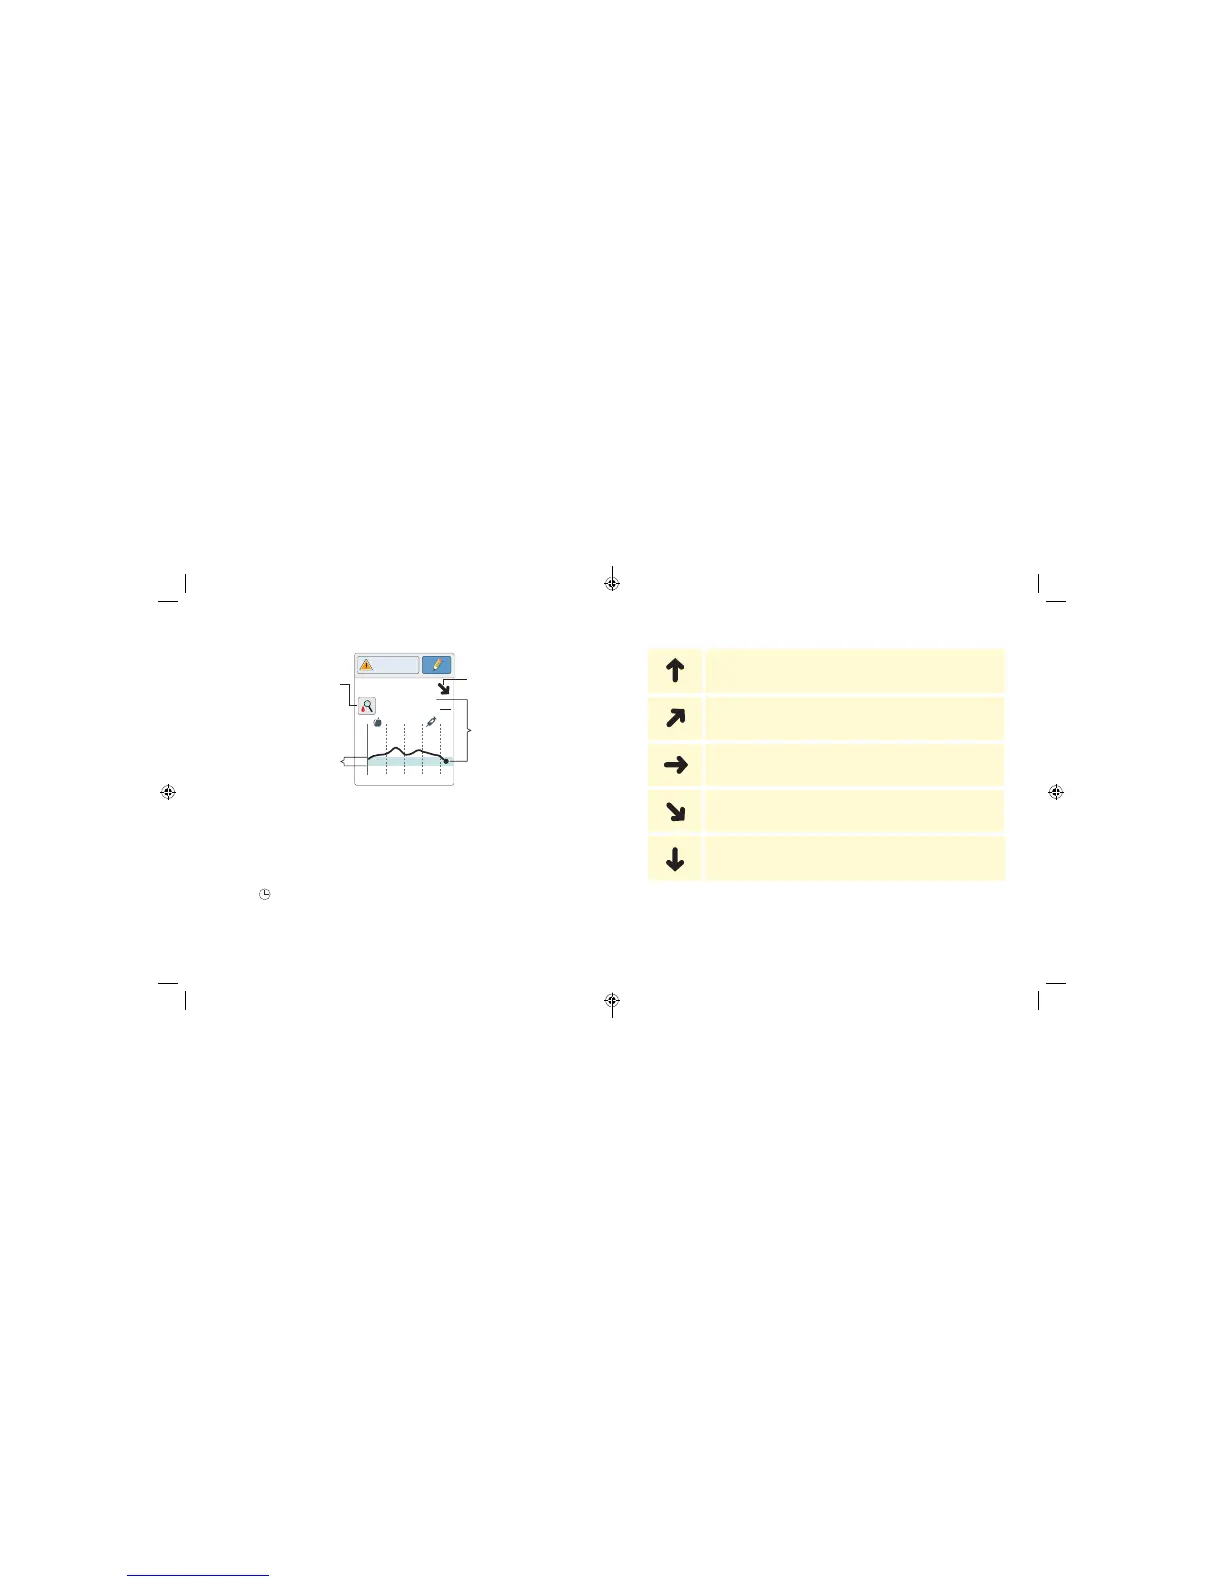
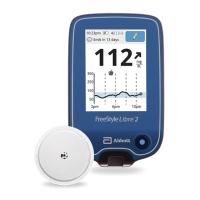
Sensor Glucose Readings
Notes:
• While Sensor glucose readings are gathered in the System range of
40-500 mg/dL, the graph display range is 0-350 mg/dL for ease of
review on screen. Glucose readings above 350 mg/dL are displayed
at 350 mg/dL. For sequential readings above 350 mg/dL, a line is
displayed at 350 mg/dL.
• The symbol may appear, indicating the Reader time was changed.
Gaps in the graph may result or glucose readings may be hidden.
350
250
150
50
2pm 6pm 10pm
82
mg
dL
Glucose Going
Low
Glucose Trend Arrow
Current Glucose
Target Glucose Range
Check Blood Glucose
When you see this symbol,
do a blood glucose test
before making treatment
decisions.
The Glucose Trend Arrow gives you an indication of the direction your
glucose is going.
Glucose is rising quickly
(more than 2 mg/dL per minute)
Glucose is rising
(between 1 and 2 mg/dL per minute)
Glucose is changing slowly
(less than 1 mg/dL per minute)
Glucose is falling
(between 1 and 2 mg/dL per minute)
Glucose is falling quickly
(more than 2 mg/dL per minute)
Note: The Glucose Trend Arrow may not always appear with your reading.
29 30
ART38553-101_rev-A_manual.indd 29-30 2/1/18 2:13 PM