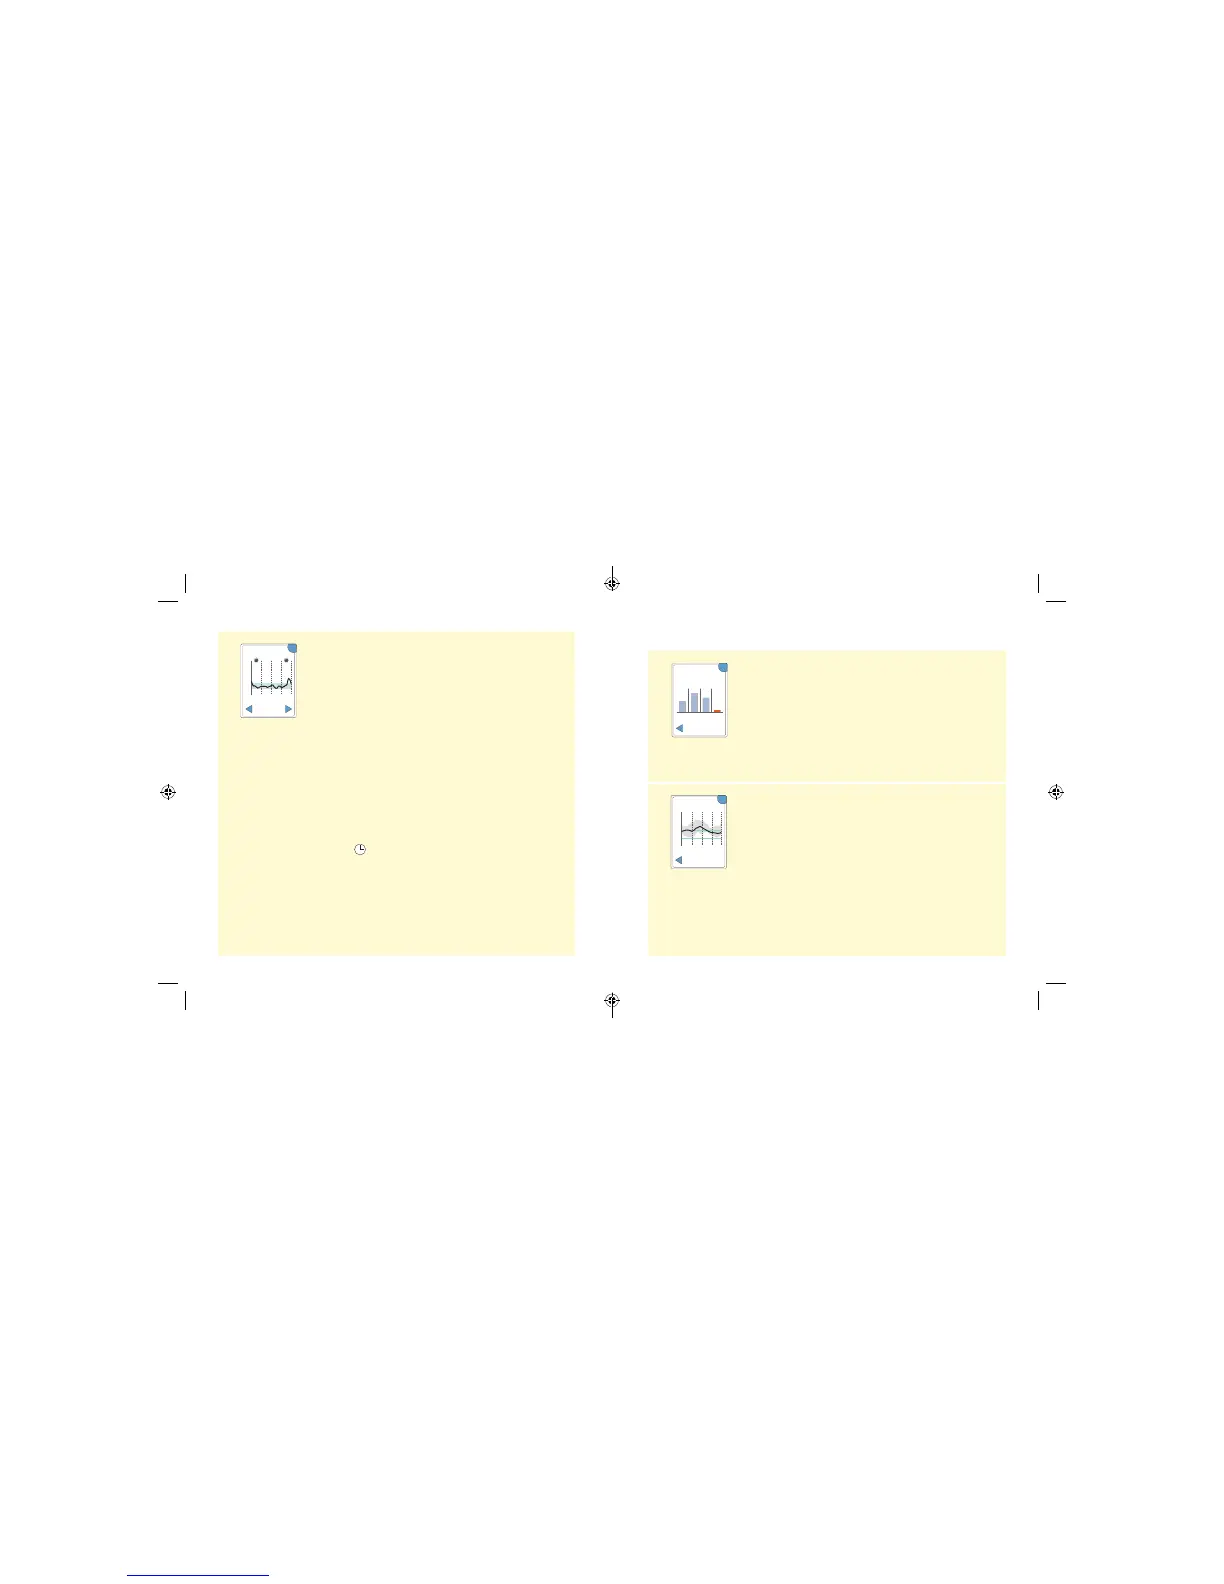
Daily Graph
A graph of your Sensor glucose readings by day.
The graph shows your Target Glucose Range and
symbols for food or rapid-acting insulin notes you
have entered.
Notes:
• While Sensor glucose readings are gathered in
the System range of 40-500 mg/dL, the Daily
Graph display range is 0-350 mg/dL for ease
of review on screen. Glucose readings above
350 mg/dL are displayed at 350 mg/dL. For
sequential readings above 350 mg/dL, a line
is displayed at 350 mg/dL.
• You might see gaps in the graph during times
when you have not scanned at least once in
8 hours.
• The symbol may appear indicating the
Reader time was changed. Gaps in the graph
may result or glucose readings may be hidden.
12
am
6
am
12
pm
6
pm
12
am
350
250
150
50
OK
Daily Graph
(mg/dL)
22 Feb
Wednesday
Other History Options
Use the arrows to view information about your last 7, 14, 30, or 90 days.
Average Glucose
Information about the average of your Sensor
glucose readings. The overall average for the time
is displayed above the graph. The average is also
shown for four dierent 6-hour periods of the day.
Readings above or below your Target Glucose
Range are orange, while readings in range are blue.
Daily Patterns
A graph showing the pattern and variability of your
Sensor glucose over a typical day. The thick black
line shows the median (midpoint) of your glucose
readings. The gray shading represents a range
(10-90 percentiles) of your Sensor readings.
Note: Daily Patterns needs at least 5 days of
glucose data.
OK
Last 7 Days
12
am am ampm pm
6 12 6 12
121
152
134
Average:
119 mg/dL
69
Average Glucose
12
am
6
am
12
pm
6
pm
12
am
350
250
150
50
OK
Daily Patterns
(mg/dL)
Last 7 Days
55 56
ART38553-101_rev-A_manual.indd 55-56 2/1/18 2:13 PM