4-16
Ver.1.36
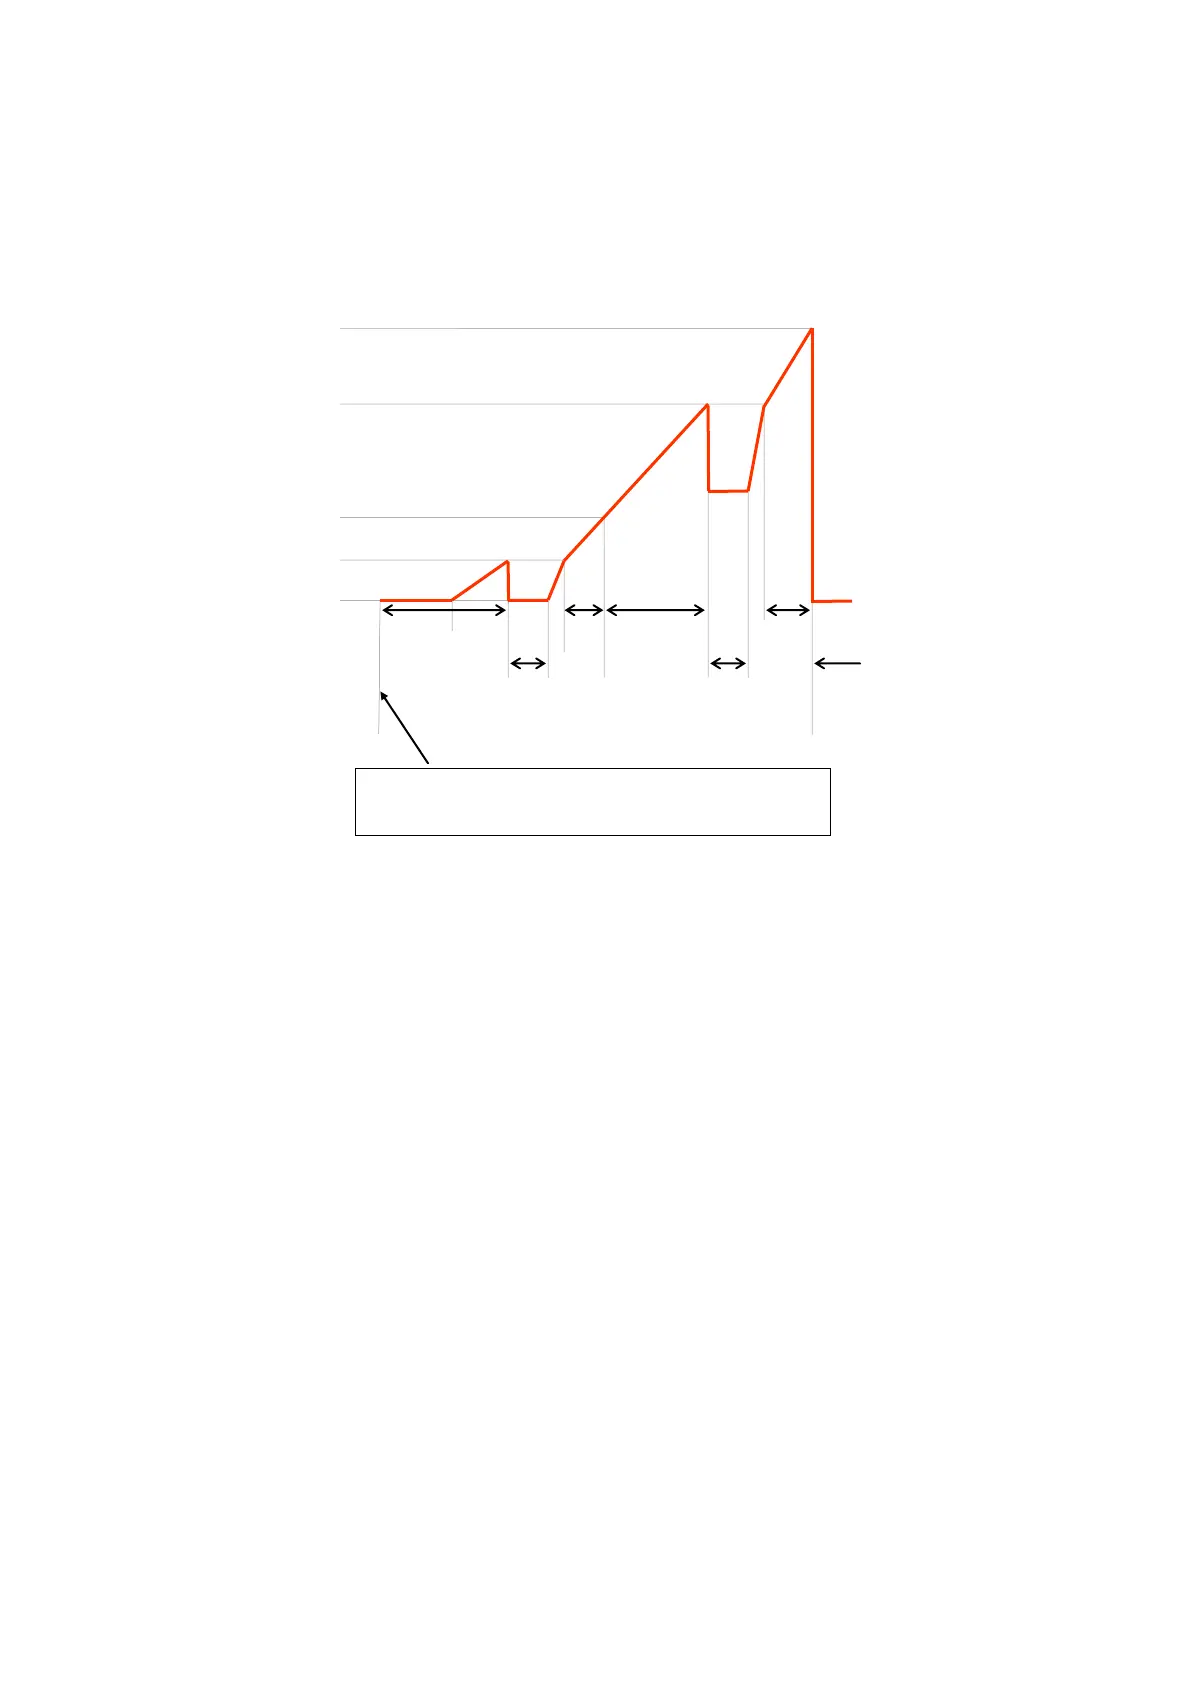
This completes the operational sequence for a Heart-Cut EGA analysis. Fig. 4.20 below shows the
schematic diagram for a series of operational events as described above.
Fig. 4.20 Sequence diagram of Heart-Cut EGA Analysis
(In this example, Zones A through D are sampled, but Zone B is not analyzed.)
Dialog box (Ready for injection) is displayed. As soon as the
sample cup is dropped to the pyrolyzer furnace, click the
“START” button. At this point, GC analysis is not started.
 Loading...