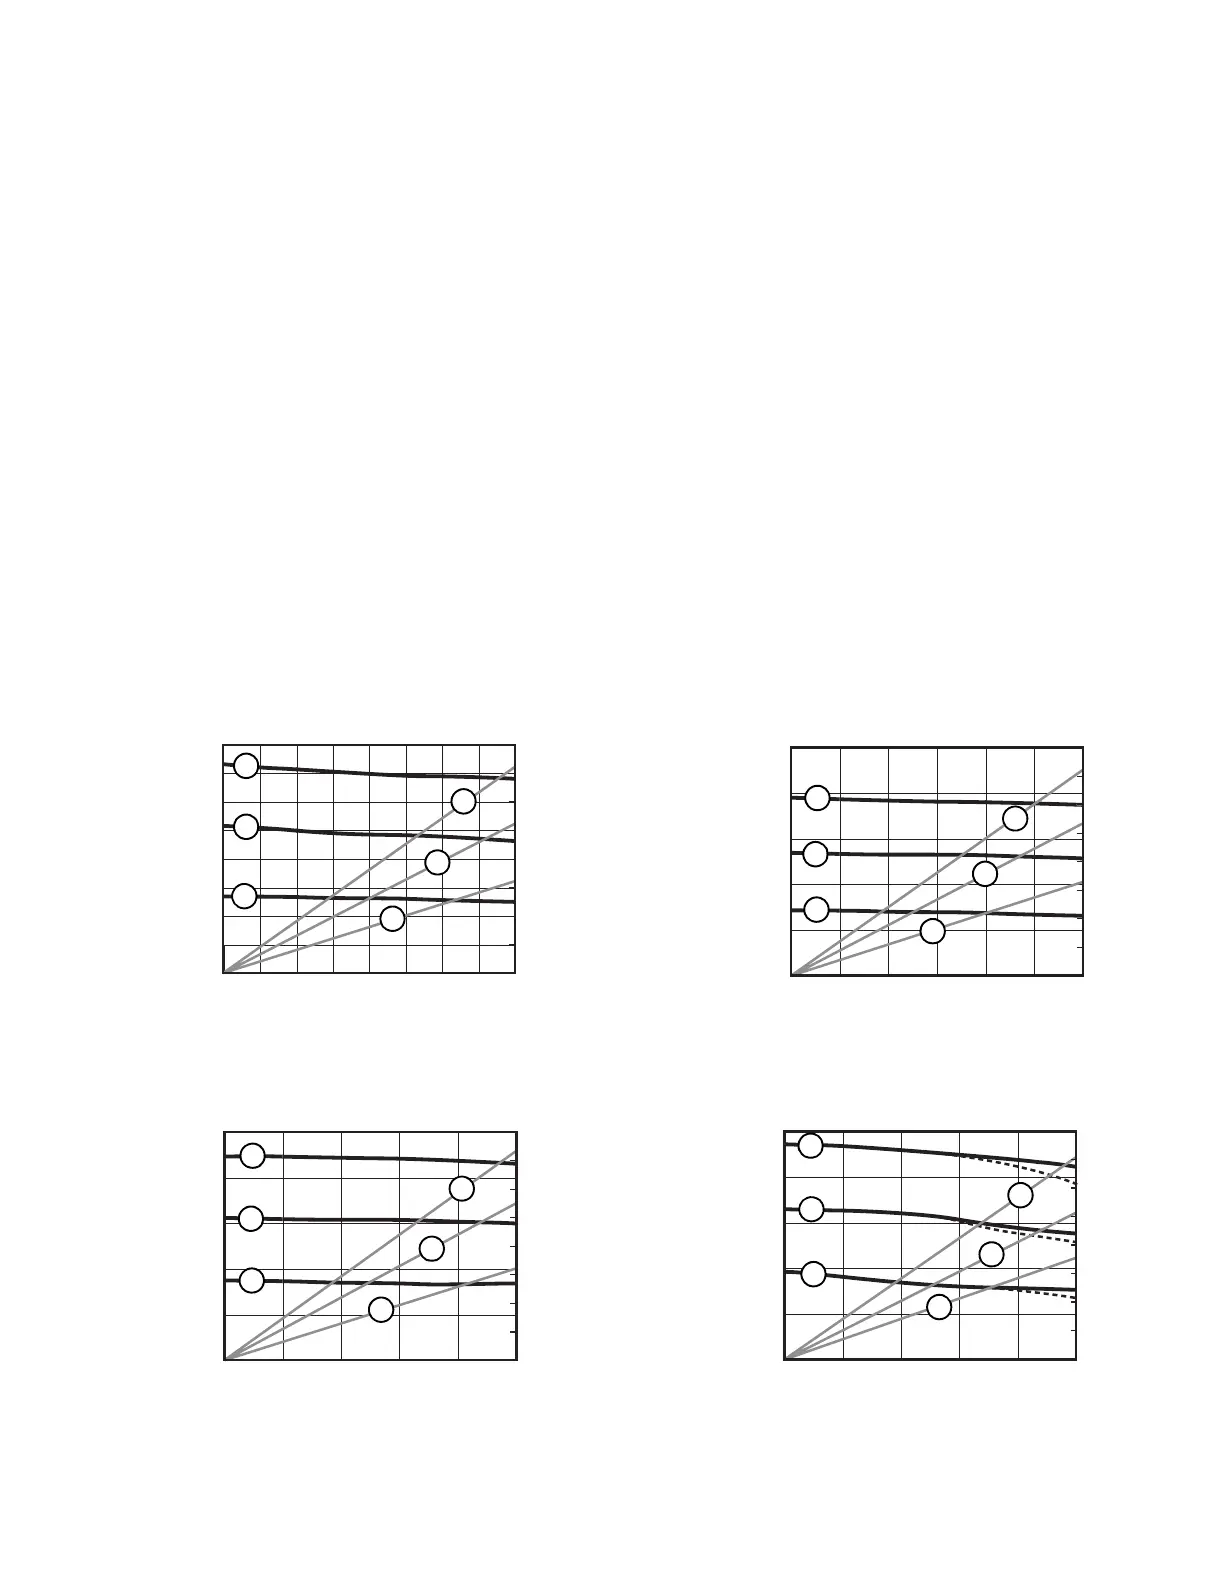
Pump Package Performance Charts
311164M 57
Pump Package Performance Charts
Calculate Fluid Outlet Pressure
To calculate fluid outlet pressure (psi/MPa/bar) at a spe-
cific fluid flow (gpm/lpm) and operating air pressure
(psi/MPa/bar), use the following instructions and pump
data charts.
1. Locate desired flow along bottom of chart.
2. Follow vertical line up to intersection with selected
fluid outlet pressure curve. Follow left to scale to
read fluid outlet pressure.
Calculate Pump Air Flow/Consumption
To calculate pump air flow/consumption (scfm or
m
3
/min) at a specific fluid flow (gpm/lpm) and air pres-
sure (psi/MPa/bar), use the following instructions and
pump data charts.
1. Locate desired flow along bottom of chart.
2. Follow vertical line up to intersection with selected
air flow/consumption curve. Follow right to scale to
read air flow/consumption.
16:1 Xtreme Pumps
Fluid Pressure in psig (MPa, bar)
Fluid Flow in gpm (lpm)
Air Flow in SCFM (m
3
/min)
800
1200
1600
400
02.0
3.01.0
(3.8)
(7.6)
(11.4)
4.0
(15.2)
21:1 Xtreme Pumps
Fluid Flow in gpm (lpm)
Fluid Pressure in psig (MPa, bar)
Air Flow in SCFM (m
3
/min)
0
2.0
3.0
1.0
(3.8)
(7.6)
(11.4)
(11.2, 112)
(8.4, 84)
(5.6, 56)
(2.8, 28)
24:1 Xtreme Pumps
Fluid Pressure in psig (MPa, bar)
Air Flow in SCFM (m
3
/min)
Fluid Flow in gpm (lpm)
0
2.0
3.0
1.0
(3.8)
(7.6)
(11.4)
Fluid Pressure in psig (MPa, bar)
Fluid Flow in gpm (lpm)
0
5.03.0
Air Flow in SCFM (m
3
/min)
25:1 Xtreme Pumps
(11.4)
(19.0)
1.0
(3.8)
Key: Air Pressure
A 100 psi (0.7 MPa, 7 bar)
B 70 psi (0.5 MPa, 7.8 bar)
C 40 psi (0.3 MPa, 2.8 bar)
Dashed lines indicate low noise motors.
80
(2.2)
60
(1.7)
40
(1.1)
20
(0.6)
80
(2.2)
60
(1.7)
40
(1.1)
20
(0.6)
500
1500
2500
(17.5, 175)
(10.5, 105)
(3.5, 35)
500
1500
2500
(17.5, 175)
(10.5, 105)
(3.5, 35)
80
(2.2)
60
(1.7)
40
(1.1)
20
(0.6)
500
1500
2500
(17.5, 175)
(10.5, 105)
(3.5, 35)
160
(4.5)
120
(3.4)
80
(2.2)
40
(1.1)
A
C
A
A
B
B
C
C
A
A
A
A
A
B
B
B
B
B
C
C
C
C
C
B