Hex GS-911 for BMW Motorcycles
_________________________________________________________________________________________________
_________________________________________________________________________________________________
© Hex Innovate 2021-2022 Page 30 of 38 GS-911 2207.2
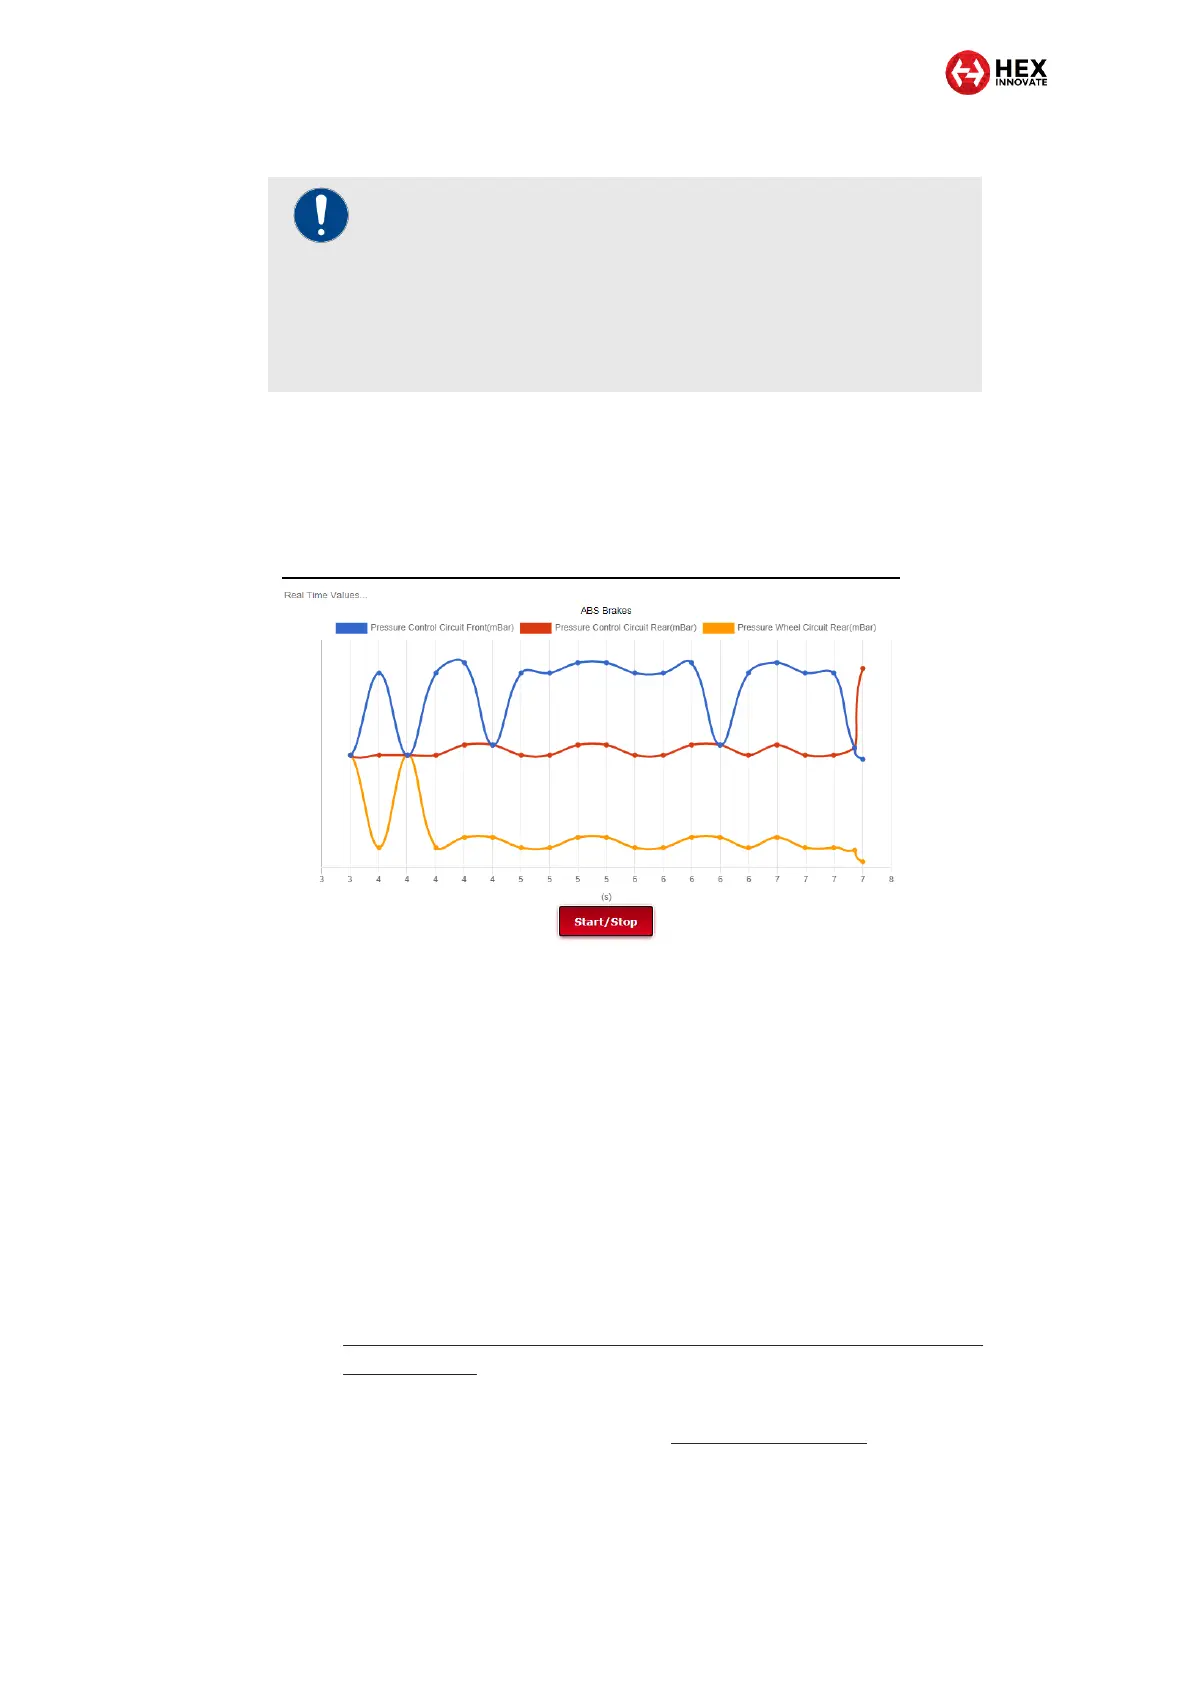
7. To view the data stream as a dynamic 2-D graph, click Display
Graph Start/Stop.
The Real Time Values… pane will chart all chosen
parameter values for the module in real time (a typical
example is shown below).
8. If needed, pause or stop the real-time view by clicking Start/Stop
a second time.
9. To resume the real-time view, click Start/Stop again.
The real-time values shown in the Display Values… and Real-time
Values… panes can be used for diagnostic troubleshooting as follows:
You can compare the shown values with baseline values that are
known to be normal (in other words, with conditions that must be
satisfied for the relevant system to work properly).
If you checked the Log to memory card check-box, the telemetry
stream is saved as a *.CSV file. For instructions on how to read
the saved data as a static 2-D graph, refer to
https://www.hexgs911.com/faq/how-do-i-import-and-view-the-csv-
realtime-data/.
To check whether a component is faulty by doing actuation tests on the
motorcycle’s electronic components, see Service functionality.
IMPORTANT
To be able to view data streams as a dynamic 2-D graph,
you must:
Un-check the Log to memory card check-box.
Check a maximum of two parameter value check-
boxes.