58 Chapter 5: Device operation
Monitoring screen
The ventilation parameters are shown in real time on the monitoring screen.
The monitoring screen is divided into 2 sections:
• Measurements
• Graphs
Measurements
Depending on the configuration, the following parameters are shown under “Mon-
itoring” > “Measurements” when ventilation is active:
• Pressure (p),
• Frequency (f)
• Inspiration to expiration
ratio (I:E)
• Minute ventilation (MV),
• Volume Inspiration (V
I
),
• Leak rate
• FiO
2
concentration (FiO
2
)
PCV
Set 1
75%
50
40
30
20
10
0
p
hPa f
bpm V
I
lI:E
4,500
MV
[l]
25,0
Leck.
[l/min]
21
FiO
2
[%]
Off Off Off
GraphsMeasurements
A
B
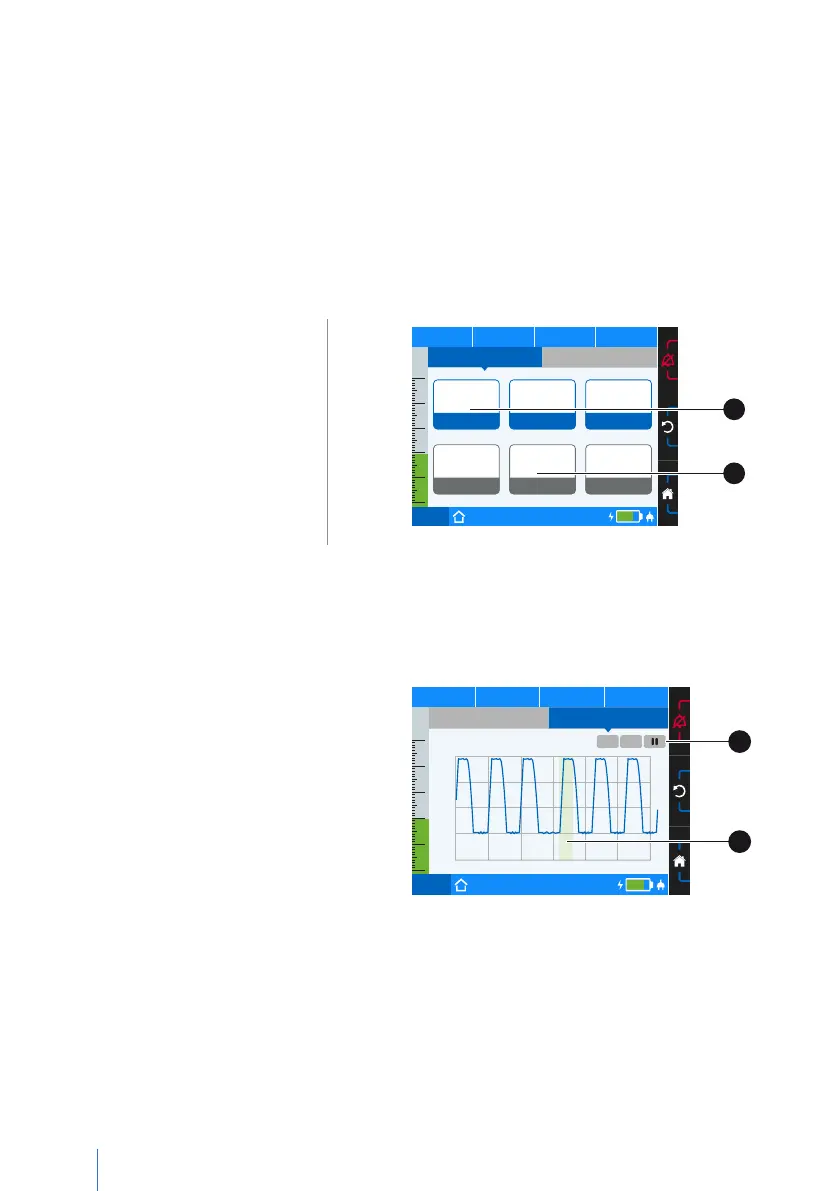
A Measurement configured
B No measurement configured
Figure 19: Measurement screen, factory setting
Graphs
The “Measurements” > “Graphs”
section displays the following
ventilation parameters when ven-
tilation is running:
• Pressure
• Flow
• Volume
• FiO
2
PCV
Set 1
75%
50
40
30
20
10
0
p 19,8 hPa f
12 bpm V
I
0,570 lI:E 1:1,5
APCV
Set 1
1/4 30s
t [s]
p [hPa]
20
15
10
5
0
-30 -25 -20 -15 -10 -5 0
Measurements
Pressure
Graphs
A
B
A Graph options B Inspiration triggered by patient
Figure 20: Graph screen