4 The PROFview XL Application Software User Manual PROFview XL
Starts a single measurement (shortcut: F5)
Each station marked in the station list as "to be measured" (
) is measured once. The measure-
ment ends automatically once the signal has been measured completely.
Starts a continuous measurement (shortcut: F6)
Each station marked in the station list as "to be measured" (
) is measured cyclically. The mea-
surement can be ended via "Stop".
End measurement (shortcut: F7)
The measurement is carried out up to the last station to be measured and then ended.
Cancel measurement (shortcut: F8)
Clicking on this button ends the measurement immediately.
While the measurement is running, an arrow symbol is displayed beneath the station currently being mea-
sured. If it is not possible to determine all measured values for a station (see Section 3.2 "Measuring the
physical bus characteristics") during the set timeout time (see Section 4.12 "Settings"), "Timeout" is dis-
played. In this case, check the status of the station in question or increase the timeout time.
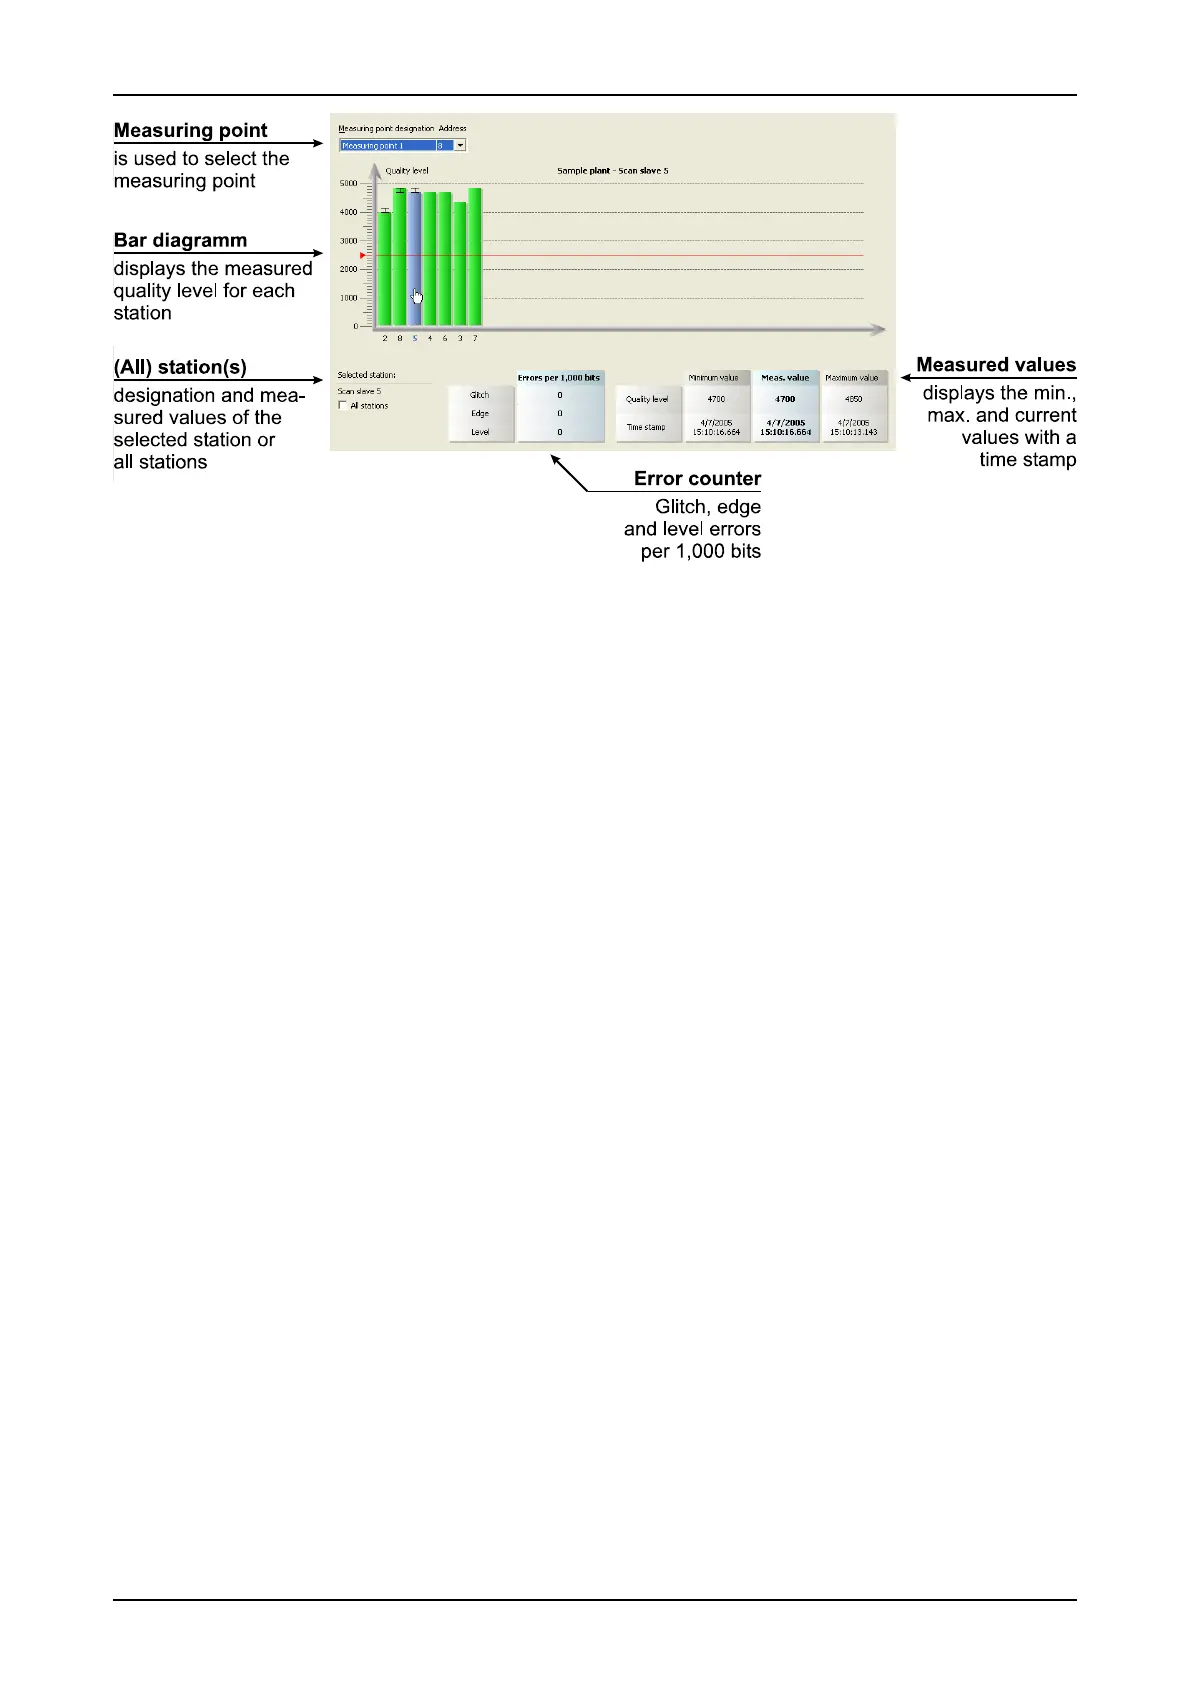
4.6.3 Evaluation
The measured stations are displayed in the diagram as a bar. If there are more than 32 stations, you can
navigate using the scrollbar. Use this view to view the measured data for the station desired and to display a
summary for all stations. To select a station, highlight the appropriate bar in the diagram. Its designation and
measured data are displayed in a separate table. The measurement data record of a station consists of the
last measured glitch, edge and level error counters, the quality level with its minimum and maximum values
from the last continuous measurement and the appropriate time stamps.
If you activate the "All stations" field under "Selected station" or if you deselect a bar (click on a point outside
the diagram), the measured-value display will switch from one station to a summary of all stations. The totals
of the values of all stations are displayed by the error counters. The minimum (maximum) value specifies the
smallest (largest) quality level for all stations. The central column ("Average") specifies the average value of
all individual values measured.
With the automatic evaluation activated ("Configure segment" view), a red line highlighting the critical quality
level is to be seen in the bar diagram. This bar is yellow if the minimum value of a station is below this limit. If
the value is above the limit, the bar is displayed in green.
4.7 "Measure Stations" view
4.7.1 How to use
This measurement serves to study one single station more specifically. The view shows the disturbance-free
voltage range, the worst rising and the worst falling edges, a section of the signal waveform and the last de-
tected frame of the selected station. Fig. 9 shows a screenshot of this view.
22 PROFview XL
Fig. 8: "Quality Levels All Stations" view