Do you have a question about the Intel S1400FP and is the answer not in the manual?
Lists all possible events generated by the Intel platform, excluding external sources.
Details industry standards like IPMI, BMC, and Intel Intelligent Power Node Manager for server management.
Explains default values for SEL records, including Record Type, Generator ID, and Event Message Revision.
Provides guidance on capturing SEL logs, including human-readable and hex versions, and handling OEM-specific data.
Illustrates how to decode BIOS timestamp events logged during POST and OS shutdown.
Demonstrates decoding a PCI Express correctable error event, including bus, device, and function details.
Shows how to decode a power supply predictive failure event, detailing voltage warnings and fault events.
Provides details for sensors owned by the Baseboard Management Controller (BMC).
Lists details for sensors owned by BIOS POST, including memory RAS and POST errors.
Lists details for sensors owned by the BIOS SMI Handler, covering PCI and memory errors.
Details sensors managed by the Node Manager/Management Engine (ME) firmware.
Lists records generated by the Microsoft Operating System (OS), including boot and shutdown events.
Details records generated by Linux kernel panics, providing information for troubleshooting.
Describes BMC monitoring of main voltage sources, including typical characteristics and event triggers.
Explains the BMC monitoring of board VR controller power sequence and VR Watchdog Timeout.
Details how the power unit monitors system state and logs changes in the SEL.
Covers BMC monitoring of power supply subsystem status, power input, current output, and temperature.
Reports the status of power supplies in the system, logging events for failures and configuration errors.
Logs events when a power supply exceeds its AC power in threshold, indicating potential over-consumption.
Monitors current output of the 12v rail as a percentage of maximum output, logging events for over-consumption.
Describes BMC monitoring of power supply temperatures and event triggers for overheating conditions.
Details BMC polling of power supply fan status to check for failure conditions and log events.
Covers fan speed, presence, and redundancy sensors, detailing their typical characteristics and events.
Monitors fan RPM signals, logging events when fans spin too slowly or fail.
Details fan presence and redundancy sensors, used for hot-swap fans and warning of redundancy loss.
Covers various temperature sensors: threshold-based, thermal margin, processor control, DTS, discrete, and DIMM trip.
Describes linear sensors reporting actual temperature, used for front panel and baseboard monitoring.
Explains linear sensors reporting offset from critical temperature, used for fan control and DIMM grouping.
Monitors processor time constrained by thermal management, indicating potential overheating.
Details DTS-based thermal sensors for accurate thermal solution control, used as input for fan algorithms.
Reports specific overheating events like VRD Hot or Processor Thermal Trip, indicating system shutdown triggers.
Monitors DIMM thermal trip events, causing automatic server power down and SEL logging.
Reports volumetric system airflow in CFM, calculated from system fan PWM values for data center thermal management.
Monitors status information for each processor slot, logging events for asserted states until reset.
Detects asserted CATERR# signal, indicating serious hardware issues, and logs events for BMC monitoring.
Reports when a processor is not installed, often due to incorrect socket population.
Monitors the QPI bus interconnect between processors for link width reduction and error conditions.
Logs events when BIOS POST reduces QPI Link Width due to initialization errors.
Logs informational events for corrected QPI errors, indicating acceptable occurrence at low rates.
Detects and logs QPI fatal or non-recoverable errors, which are critical for system stability.
Monitors CPU's ERR2 signal assertion duration, logging events for unrecoverable fatal errors.
Monitors MSID mismatch faults indicating power rating incompatibility between baseboard and processor.
Logs memory RAS configuration status after AC power-on or during POST for configuration errors.
Records changes in RAS Mode, logging previous and selected modes for Spare Channel mode status.
Logs events when Mirroring Mode loses redundancy due to Uncorrectable ECC Errors.
Logs events when Sparing Mode loses redundancy due to Correctable ECC Errors crossing a threshold.
Covers memory data errors (correctable/uncorrectable) and address parity errors, which are fatal.
Details ECC errors divided into correctable and uncorrectable types, identifying failing DIMM modules.
Logs address parity errors affecting memory addressing, treated similarly to uncorrectable ECC errors.
Defines standard error types for PCI Express (AER) and Legacy PCI (PERR, SERR) logged to SEL.
Covers PERR and SERR errors, which are fatal errors for Legacy PCI.
Details PCI Express fatal errors reported to BIOS SMI handler, including error format and continuation.
Describes PCI Express correctable errors logged by BIOS SMI handler, considered informational.
Covers events occurring during POST or sleep state, including BIOS POST and SMI Handler events.
Logs a System Boot Event at the end of POST, marking the transition to OS Loader.
Details events for synchronizing time between BIOS and BMC for accurate log timestamps.
Logs POST errors to SEL, providing information on what caused the error, which may not be fatal.
Covers chassis intrusion and LAN leash lost sensors, monitoring physical security and network connection.
Monitors chassis intrusion on supported chassis, logging events when the chassis lid is opened or closed.
Logs events when the network port loses physical connection, indicating a LAN leash lost condition.
Logs events when a diagnostic interrupt is generated, for example, by the front panel NMI button.
Logs front panel power and reset button presses for informational purposes, not indicating errors.
Describes IPMI watchdog timer for checking OS responsiveness and BMC actions on timer expiry.
Explains SMI timeout interrupts that can freeze the system, triggering BMC reset after logging.
Logs a SEL clear event, indicating manual or factory clearing of the System Event Log.
Details Platform Event Filters (PEF) for sending alerts on logged events, requiring user configuration.
Reports BMC reset events due to BMC Watchdog feature actions, logging FW stack or CPU resets.
Tracks BMC sensor health, reporting failures for consecutive sensor errors or HAL errors.
Generates SEL events related to BMC, BIOS, and ME firmware updates, only for assertion events.
Indicates whether add-in modules/boards are installed in dedicated slots on server boards.
Details limited manageability of Intel Xeon Phi Coprocessor adapters, covering thermal margin and status sensors.
Measures ambient temperature on the Hot-Swap Backplane, logging events for threshold breaches.
Monitors HDD status through disk status sensors owned by the BMC, supporting multiple storage backplanes.
Indicates HSC health, reporting offline or degraded states due to communication issues or firmware.
Reports ME firmware health, including upgrade and application errors, via Platform Event messages.
Logs events when maintained policy power limit is exceeded over the Correction Time Limit.
Provides runtime error indications about Intel Intelligent Power Node Manager's health and services.
Indicates changes in Node Manager's operational capabilities, such as policy interface and monitoring.
Logs events when maintained policy power limit is exceeded over Correction Time Limit.
Logs boot-up and OEM events when the system boots into Microsoft Windows OS.
Records OS Stop/Shutdown events, followed by OEM records for shutdown reason and comment.
Logs Bug Check/Blue Screen events, including OS Stop/Shutdown and OEM code records for failure analysis.
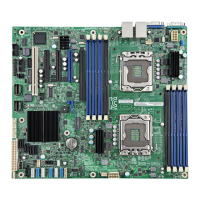
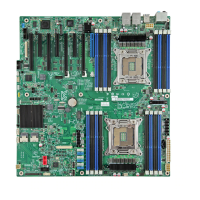
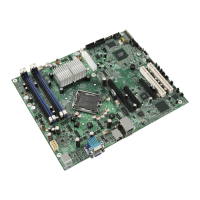
| Product Type | Server Motherboard |
|---|---|
| Form Factor | SSI EEB |
| Chipset | Intel C602 |
| Supported Memory Types | DDR3 |
| Networking | Intel 82574L Gigabit Ethernet |
| SATA | 2 x SATA 6Gb/s |
| Storage Interfaces | SATA |
| USB Ports | 4 x USB 2.0 |
| Expansion Slots | 2 x PCIe 3.0 x16 |


