Eclipse Additional Information Page 90
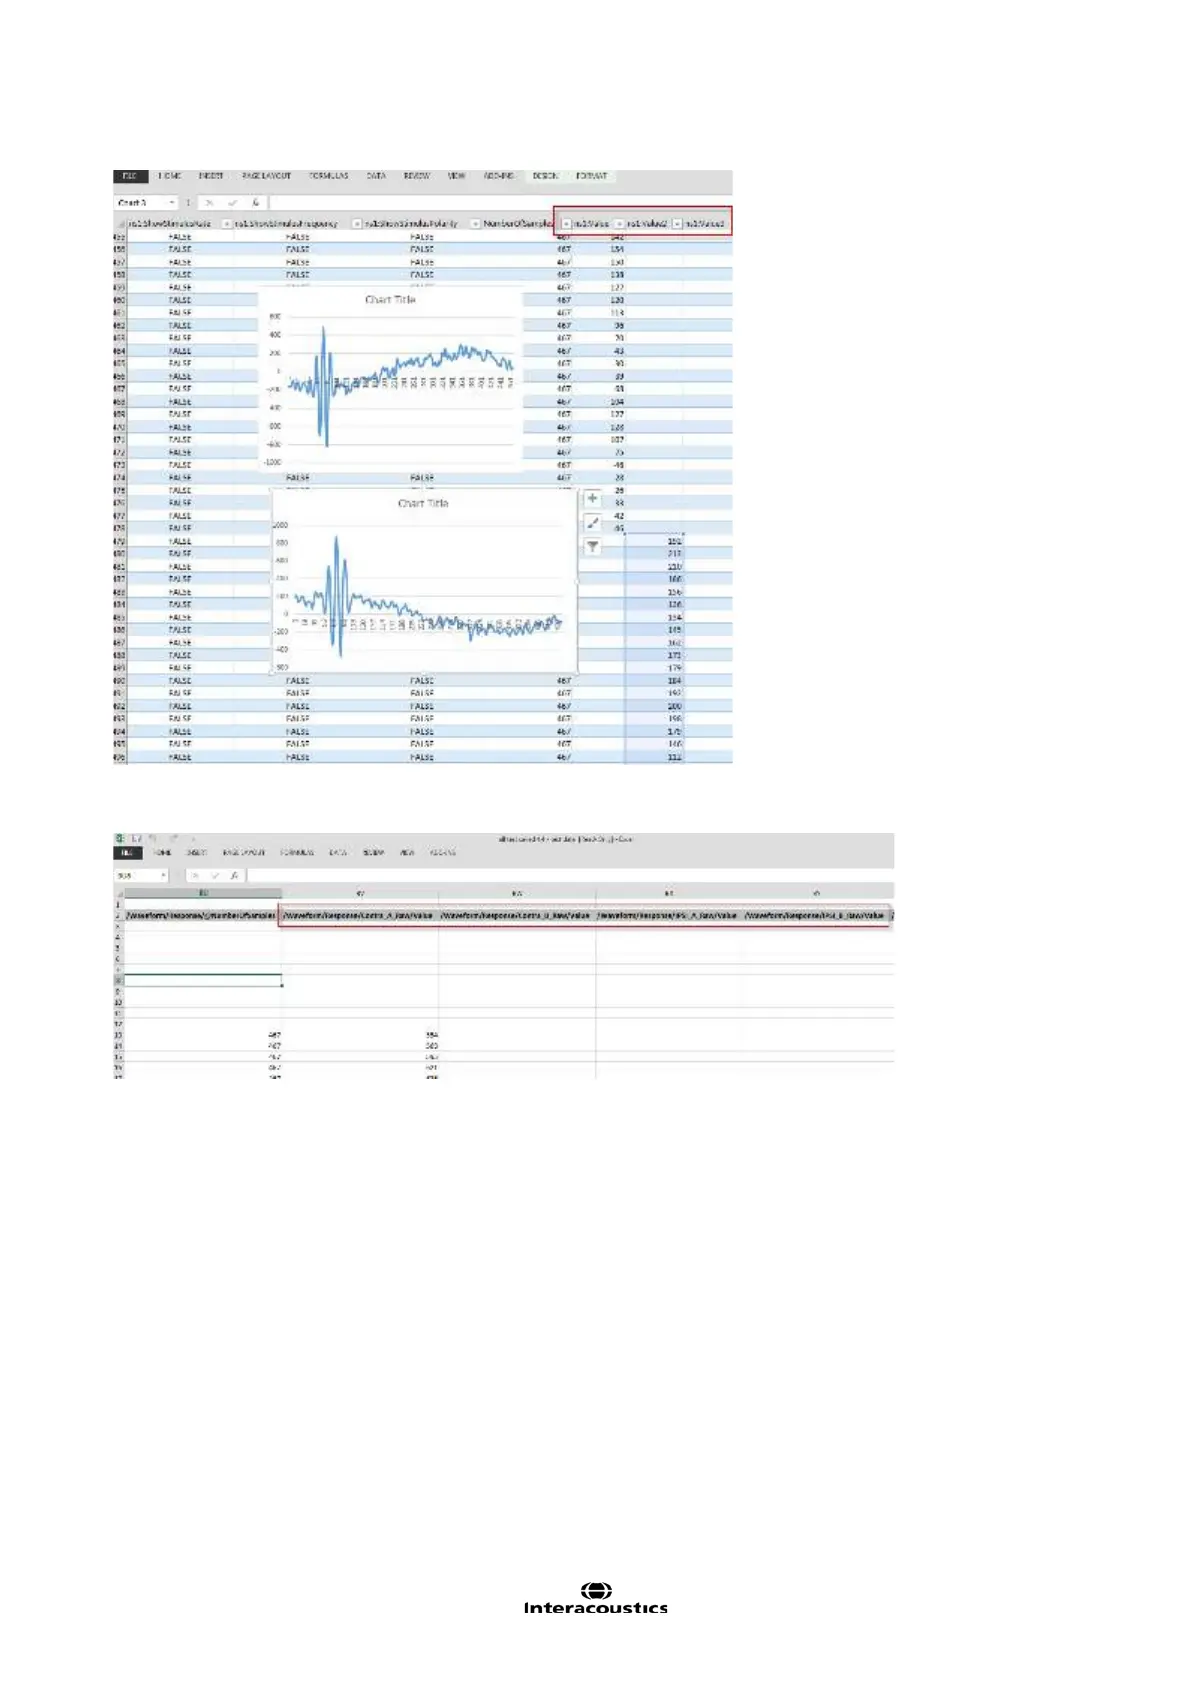
If opening from Excel and choosing the format As a read-only table workbook, the data sheet is rear-
ranged and renamed into IPSI & Contra. See picture below with the red square.
Here an example of a single block of B-Buffer data displayed as a graph in Excel. The loopback 2kHz stimuli
is presented in the beginning of the curve. The entire curve is overlaid with a 50Hz interference stimuli.