Eclipse Additional Information Page 108
3. VEMP Asymmetry Ratio
The VEMP asymmetry ratio is calculated based on the difference of the largest and smallest amplitude in
relation to the overall amplitude as shown below.
Where:
LA is the amplitude in µV (measured from the P1 marker to N1 marker) of the largest VEMP (left or right).
SA is the amplitude in µV (measured from the P1 marker to N1 marker) of the largest VEMP (left or right).
R is the right curve’s amplitude in µV
L is the left curve’s amplitude in µV
VEMP Asymmetry Analysis
VEMP responses vary across patients and therefore, analysis is typically done comparing the amplitudes of
the right and left ears of an individual (Murnane & Akin, 2009)
When VEMP amplitudes from right and left are similar, the numeric value will be close to 0.00.
A number of studies report upper limits of normal for cVEMP recordings between 35 – 45% depending on
the use of EMG monitoring and scaling of the response. In a study by McCaslin and colleagues (2013), the
upper limit of normal was reported as ~31-37 % when both EMG monitoring and scaling was applied.
A large study investigating the normal characteristics of the oVEMP by Piker and colleagues (2011) defined
an upper limit of oVEMP amplitude asymmetry to be 34% (mean + 2 SD).
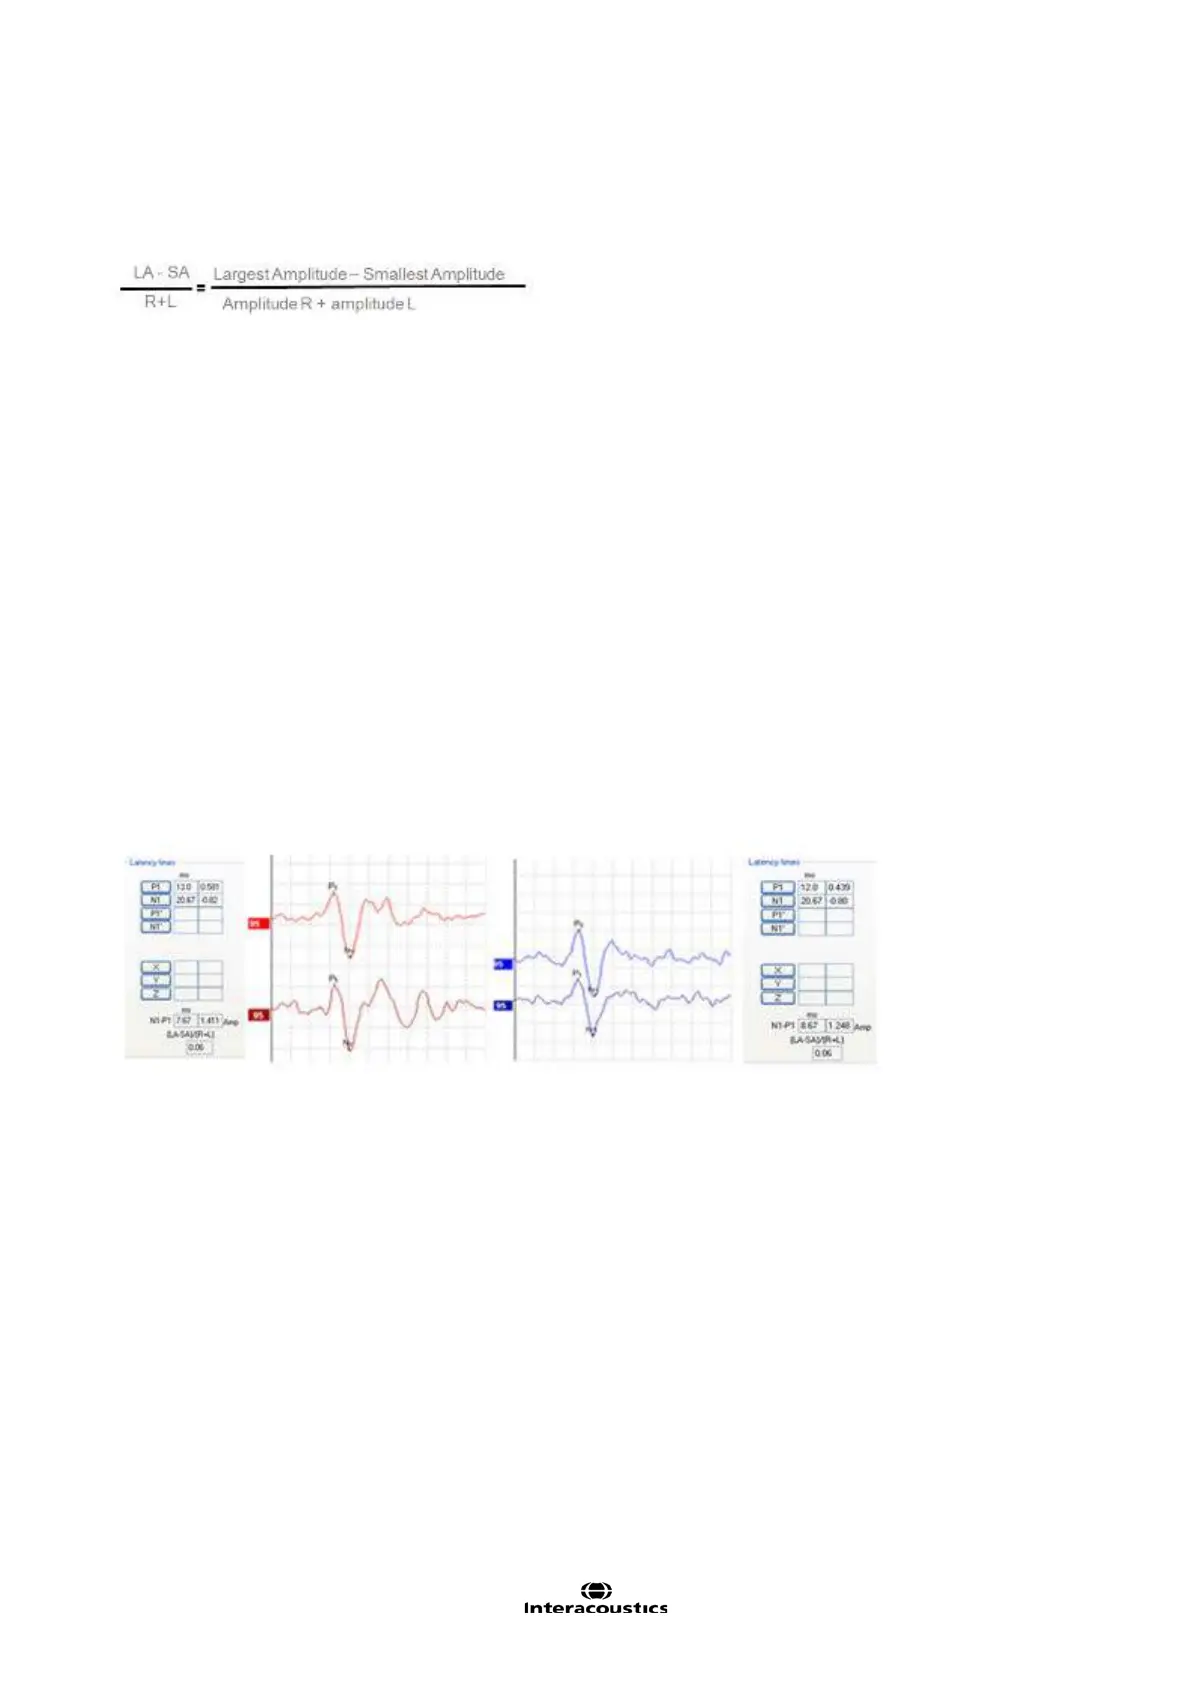
The example below shows similar recorded cVEMP responses from left and right ears, producing a normal
asymmetry ratio - the scaled waveform calculation is 0.06.
This asymmetry ratio value becomes larger when VEMP amplitudes have a greater variation between right
and left. When the calculated VEMP ratio exceeds a certain value, an increased amplitude waveform on one
side is present.