Eclipse Additional Information Page 159
2. Stimulus shows the stimulus chosen in the system setup.
3. Test status shows the status of the test during testing.
4. Ear shows which ear is being tested.
5. Start/Stop will Start or Stop the test. NOTE If there is too much EEG noise, the test will be in Pause
mode, waiting for the noise to settle down before starting.
6. Pause will pause the test.
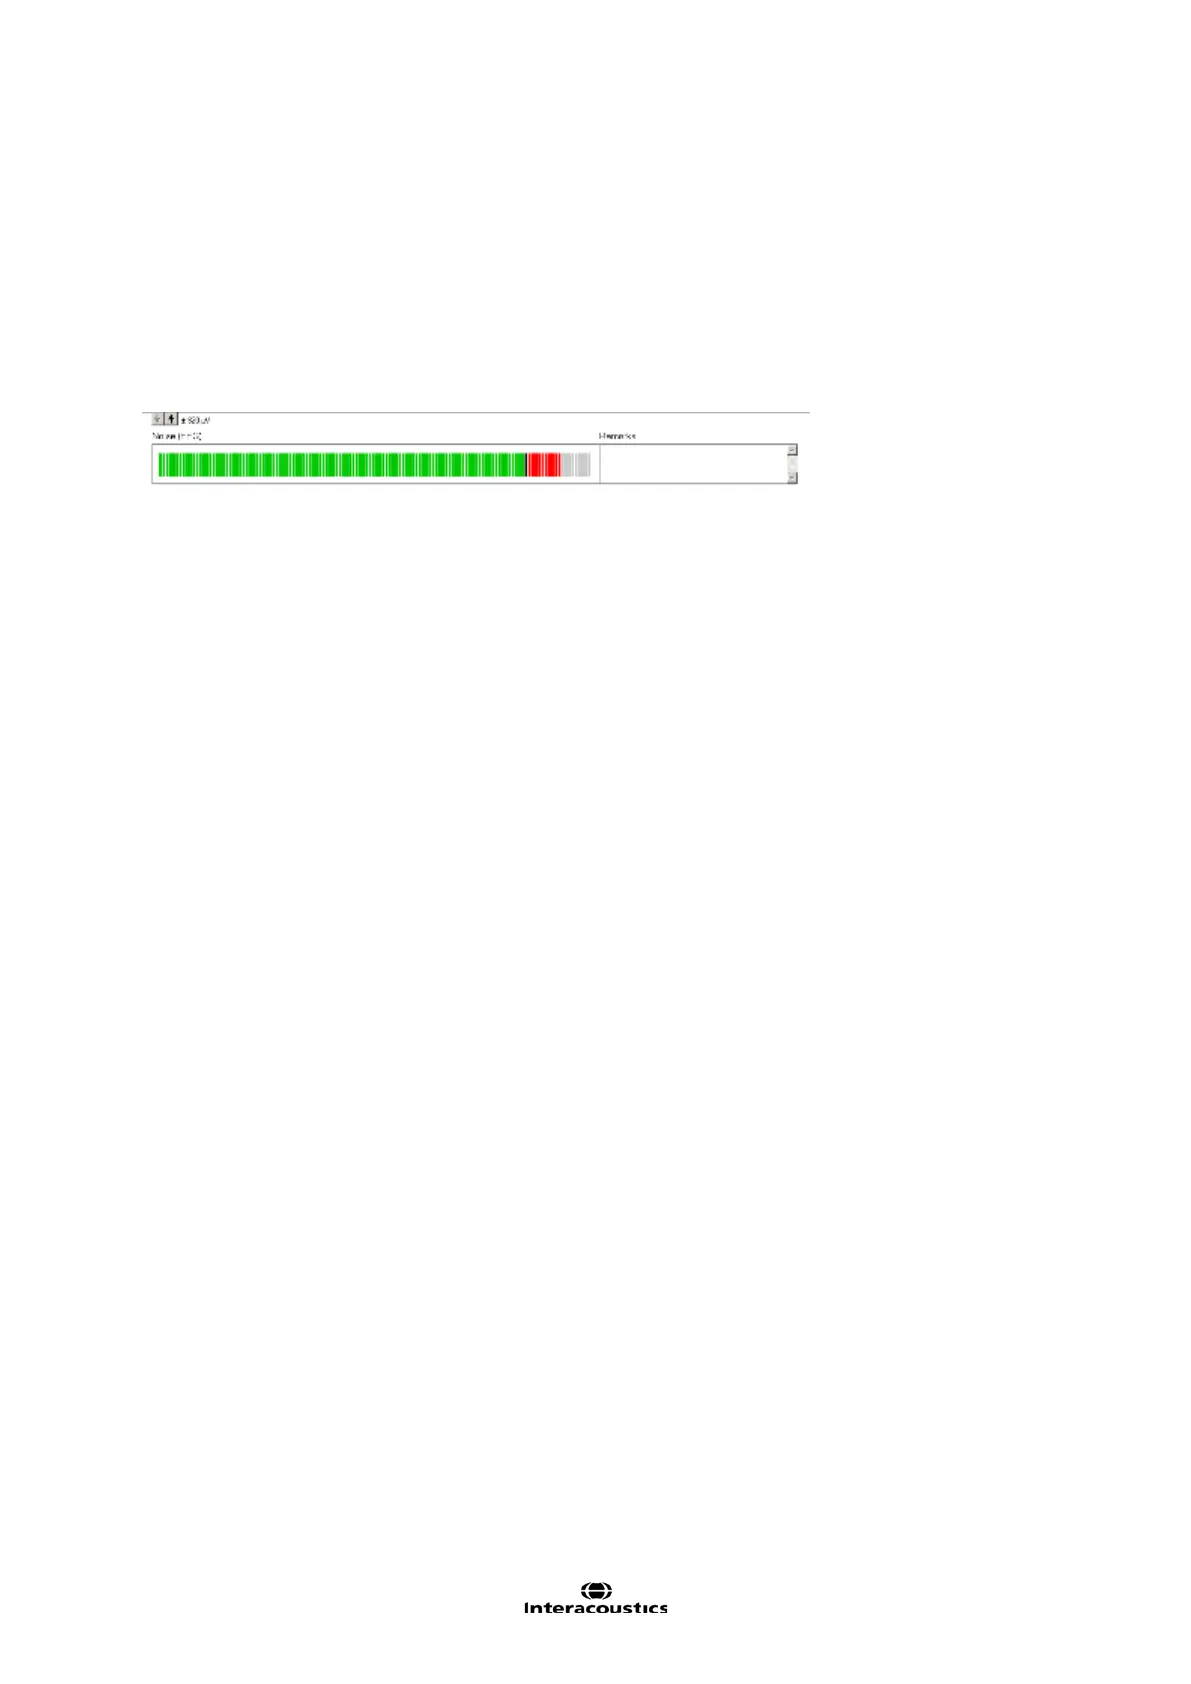
7. EEG shows the EEG. The graph will turn red when the measurements are rejected (too much noise). Ad-
just the EEG by using the arrows or changing the setup. If the EEG is deactivated the noise bar will be
displayed instead, as shown below. Green indicates acceptable EEG level and Red indicates an EEG
level that is too high (e.g. caused by poor electrode contact or a restless baby).
8. AEP waveform - Shows the AEP waveform. Due to the nature of the stimulus, this cannot be compared
to traditional ABR waveforms.
9. In the Remarks you can add your comments to the measurement.
10. Status shows the status of ABRIS (Ready, running etc.).
11. Shows the running curve in the graph window. The graph shows the time on the x-axis and the response
confidence in percentages on the y-axis. Note that the first 13 seconds no pass will be accepted. Blue -
left or red right indicate the ear being tested. If the curve rises to 100% before timing out (at 120 sec-
onds), the test will stop giving a Pass indication. If timeout is reached without getting to 100% a Refer dis-
played.