Eclipse Additional Information Page 186
11. Probe Check: Interpreting probe check information from a graph is not always easy. Therefore the qual-
ity control that is required to perform a proper TEOAE measurement.
12. Start/Stop will start and stop the DPOAE test respectively.
13. Probe check displays the results of the probe check.
14. The stimulus graph displays the click stimulus being presented to the ear as a function of magnitude
(Pa) over time (ms).
15. TE Response: The result can be labeled with Pass or Refer and is indicated above the measurement as
soon as the result is available. Each bar indicates the frequency band width, the level of signal (OAE)
and the level of noise in dB SPL. The signal (OAE) in each frequency band is displayed in either
red/blue depending on the ear (right/left) selected. The noise in each frequency band is displayed in grey.
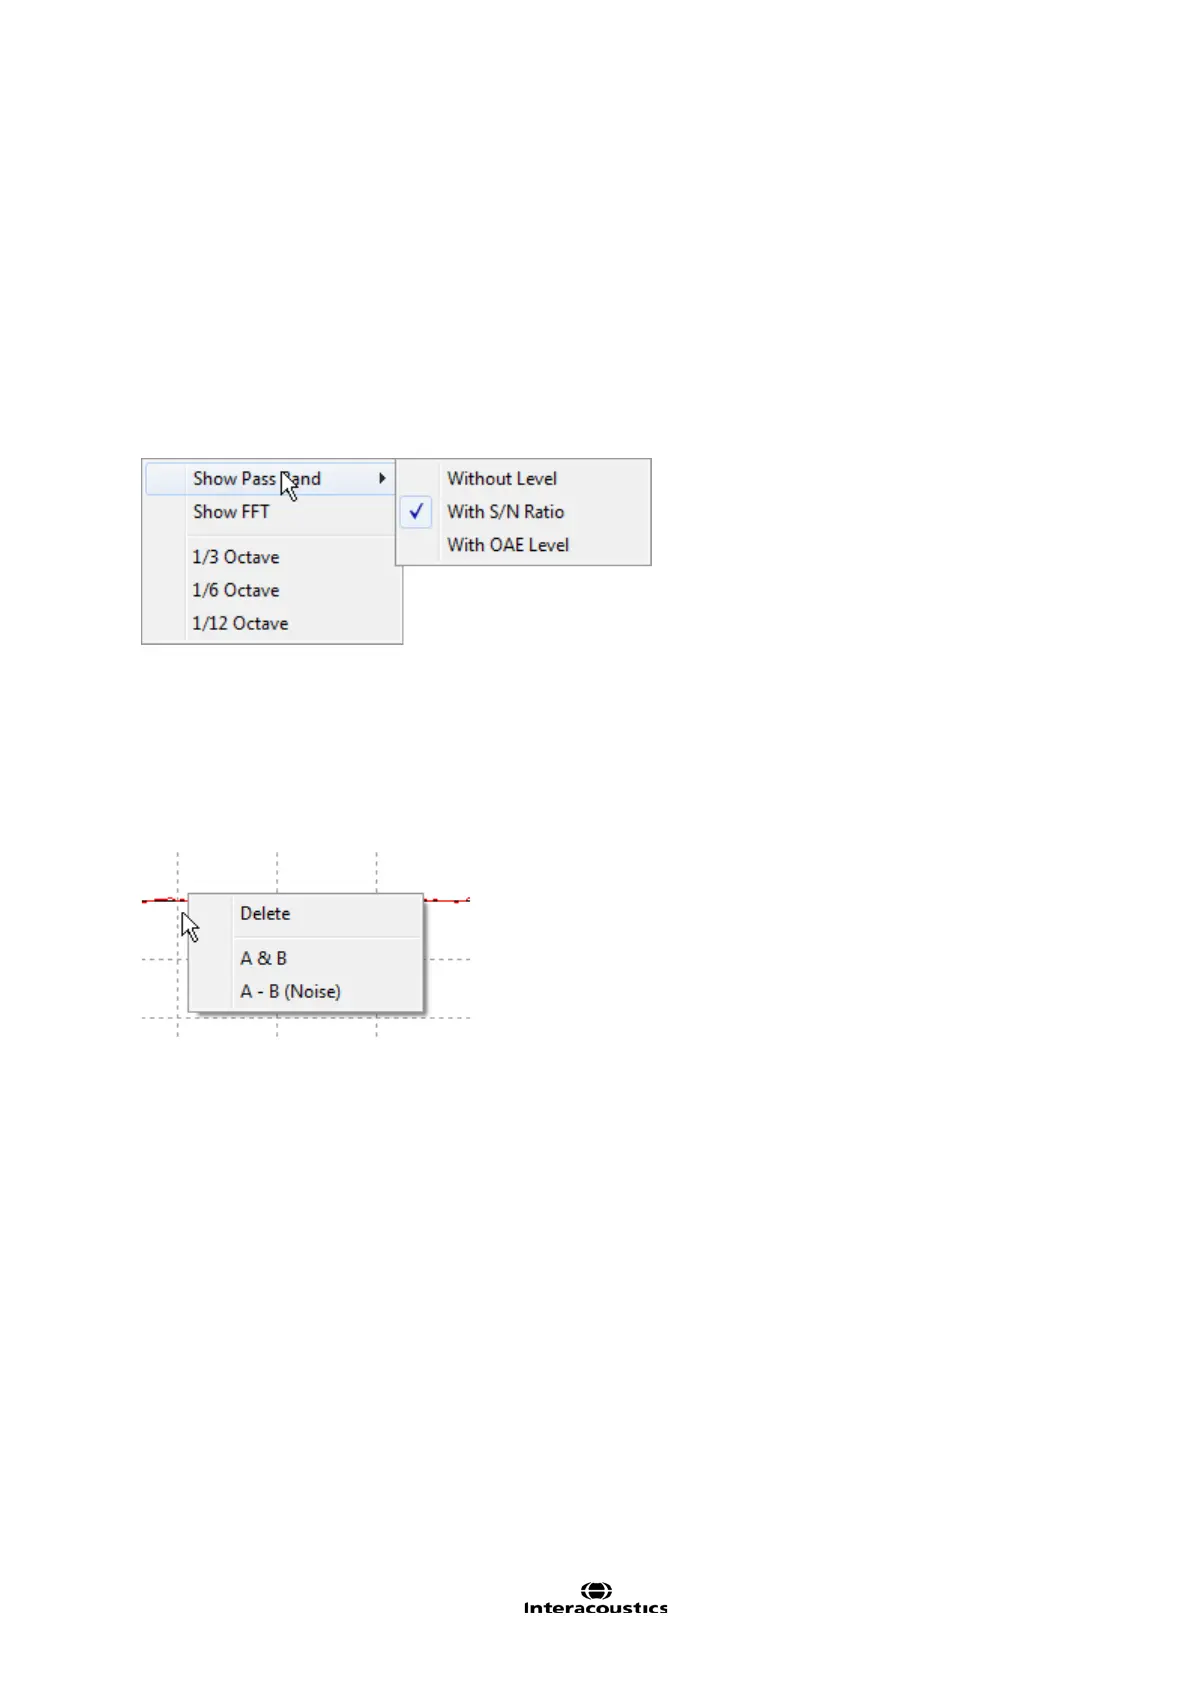
By right-mouse clicking on the Emission FFT display, a number of options are given for the display of the
frequency division of the OAE.
16. The TE response waveform graph shows the two superimposed averaged OAE waveforms (in aqua
and purple). The waveforms are displayed as a function of magnitude (mPa) over time (ms). The wave-
form reproducibility percentage is derived from the correlation between these two overlaid waveforms.
The arrows at the top of the graph indicate the recording window start and stop time. The area outside the
recording window is greyed out. The recording window start and stop time can be changed prior to start-
ing a test by moving the arrows on the graph with the mouse.
The waveform reproducibility window range is indicated by a black line on the x-axis. Only the waveform
within this range accounts for the calculation of the waveform reproducibility percentage. The waveform
reproducibility range can be changed prior to testing by moving the arrows on the graph with the mouse.
Right clicking on the response waveform graph allows for changing the display.
Delete will delete the current curve.
View buffers A & B is the default view showing the two superimposed averaged OAE waveforms.
View noise (A – B) displays the noise contamination in the waveform by the subtraction of the A and
B curves (Noise = A buffer – B buffer).