12
JPK Instruments NanoWizard
®
Handbook Version 2.2
3. Force spectroscopy
3.1 Introduction
The AFM is best known for its high-
resolution imaging capabilities, but it is also
a powerful tool for sensitive force measurements.
Information about the
sample is also available from measuring the changes while the separation from
the surface is
varied at a single point, rather than by scanning the lateral
position of the tip. In this mode the base of the cantilever is moved in the
vertical direction towards the surface using the piezo and then retracted again.
During the motion, the deflection
of the cantilever and other signals, such as
the amplitude or phase in dynamic AFM modes, can be measured. This is
usually called force spectroscopy.
The AFM tip is able to probe an extremely small interaction area (using a tip
radius in the range of 5-
50 nanometers), and this gives it a high sensitivity to
small forces. The study of interaction forces with the AFM has led to deeper
understanding of many biological and physical processes down to the single
molecule level.
Simple force curves
The data from an experiment is often displayed as a simple x-
positions for the approach or retract of the cantilever are usually chosen as the x-
axis, and the cantilever property that is being measured is the y-axis.
This is
usually the vertical deflection of the cantilever, which can give a direct measure of
the interaction force. These "force-
distance" plots are often referred to as force
curves.
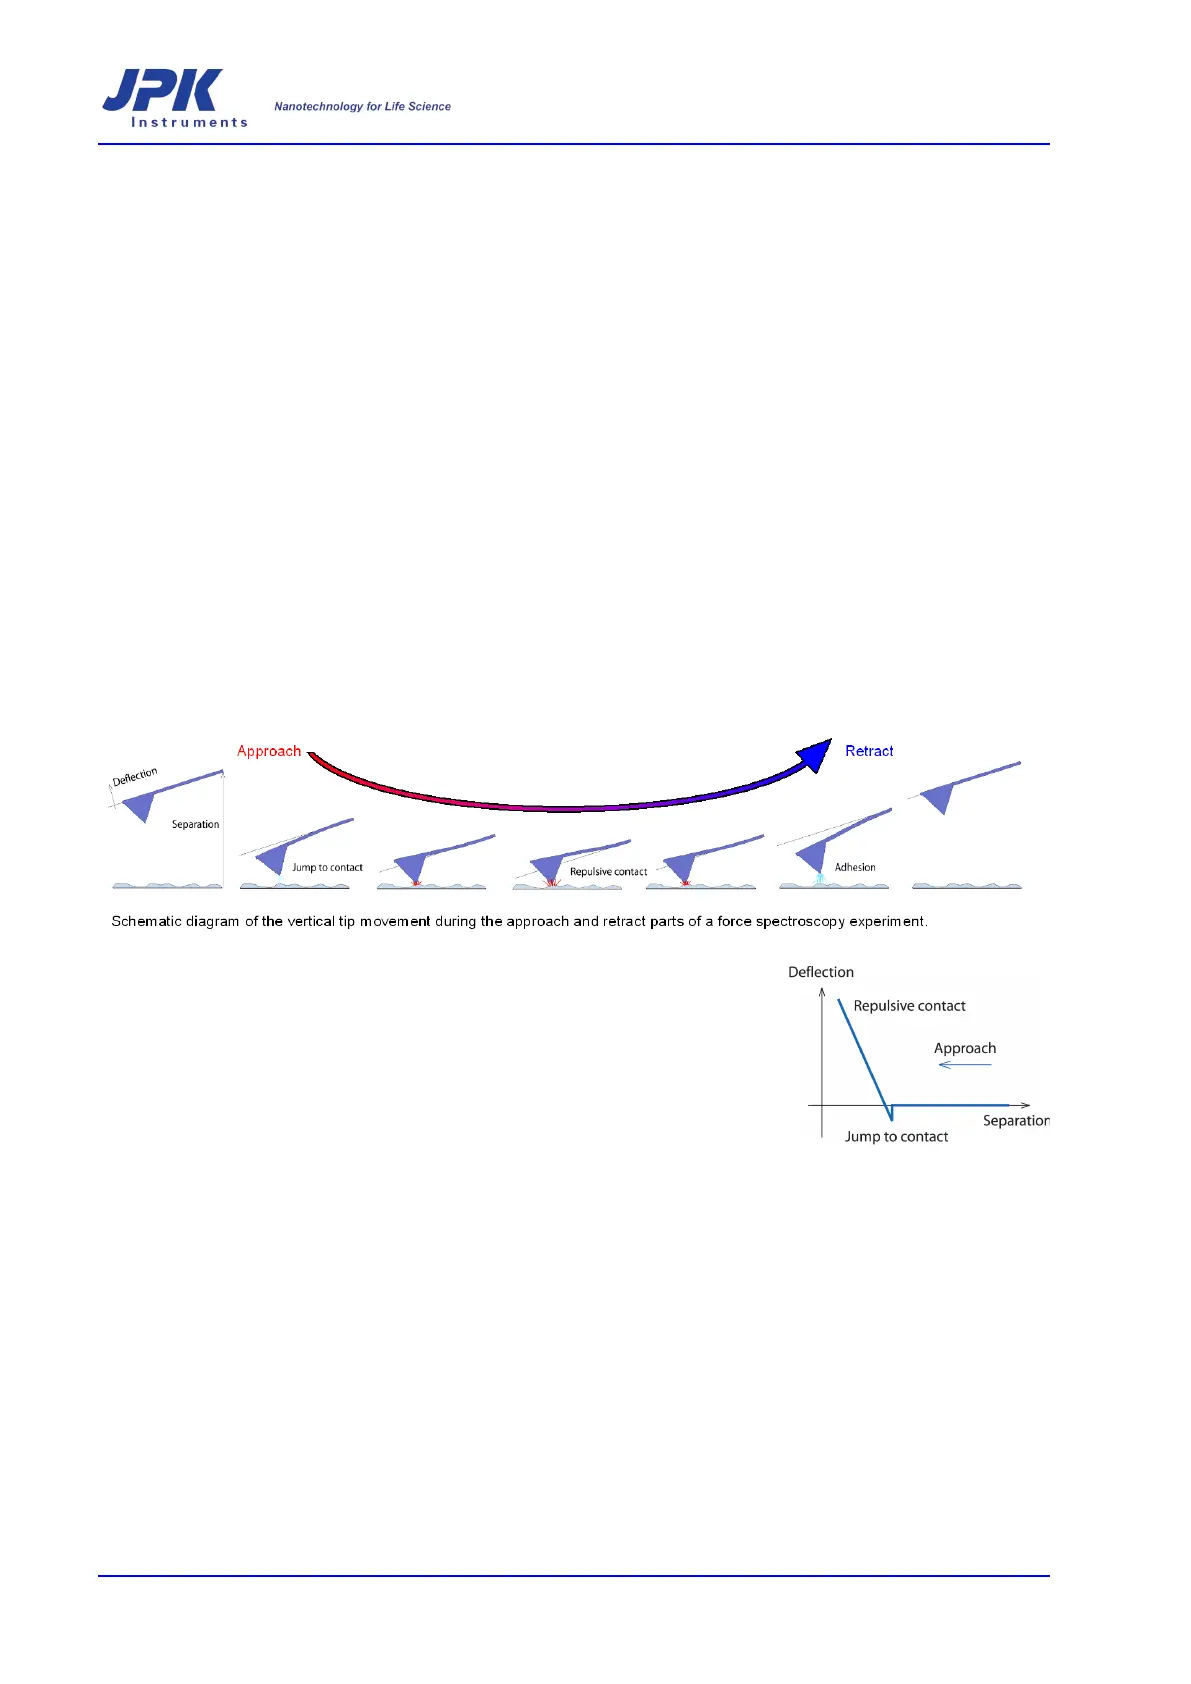
The basic force spectroscopy curves can be understood by thinking ab
out the
example of a cantilever in air approaching a hard, incompressible surface such as
glass or mica. As the cantilever approaches the surface, initially the forces are too
small to give a measurable deflection of the cantilever, and the cantilever rem
ains
in its undisturbed position. At some point, the attractive forces (usually Van der
Waals and capillary forces) overcome the cantilever spring constant and the tip
jumps into contact with the surface.