97
23 24
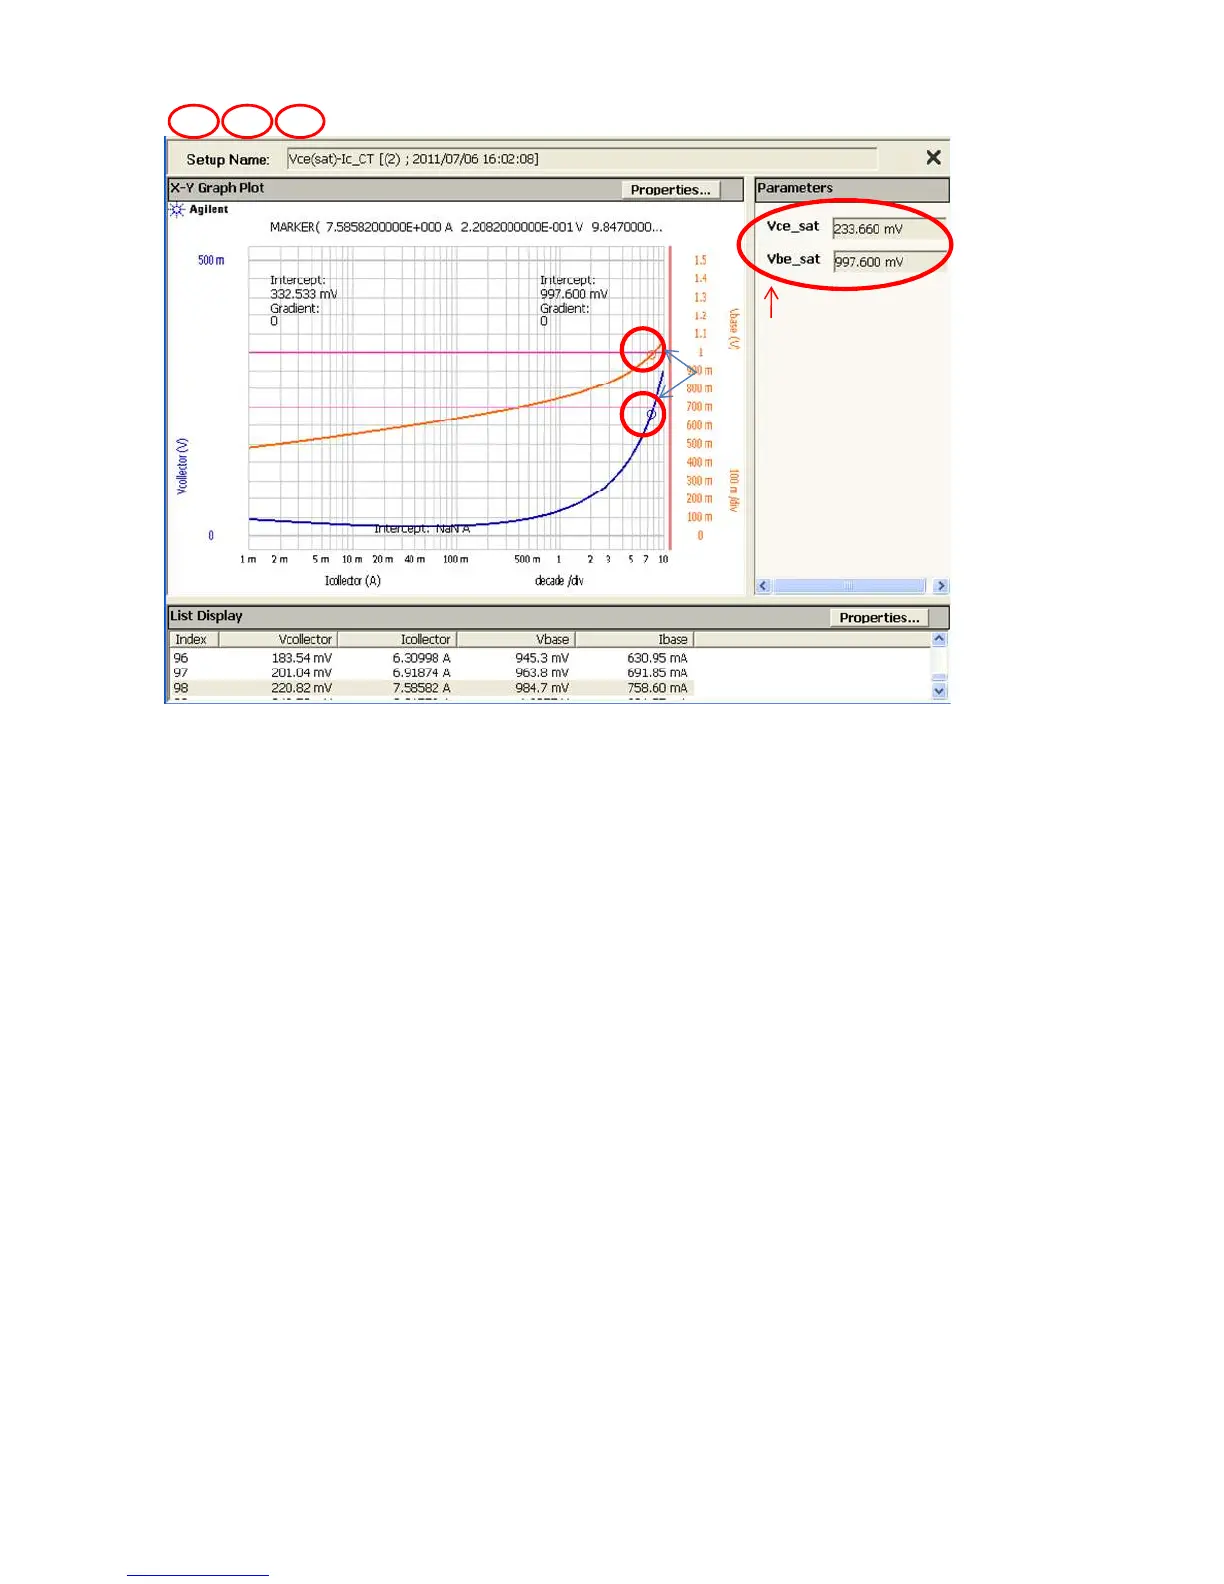
Extracted parameters
Marker for Vce(sat) and Vbe(sat)
25
Figure 3-36. Vce(sat)-Ic classic test results.
Review:
The output data shown in figure 3-36 shows exactly the same results as the figure 3
-10. The difference is the Y axis is in linear scale in the case of figure 3-36, but figure
3-10 is drawn in Log scale. You can change the scale mode very easily in the Classic
Test mode, but Application Test mode requires several steps to modify the defini-
tion.
In case the requirement is just changing the output format on that moment, it can
be changed by using the View -> Display Setup menu bar function of the Display
data window.
Tips:
As we see, the Classic Test mode requires more setup steps compared to the Appli-
cation Test mode, but the Classic Test mode allows more freedom in changing the
test setups such as the measurement functions, measurement parameters, display
parameters and format at the expense of being a little more complicated.

 Loading...