Appendix A Specifications and Application Information
92 Series E4360 User’s Guide
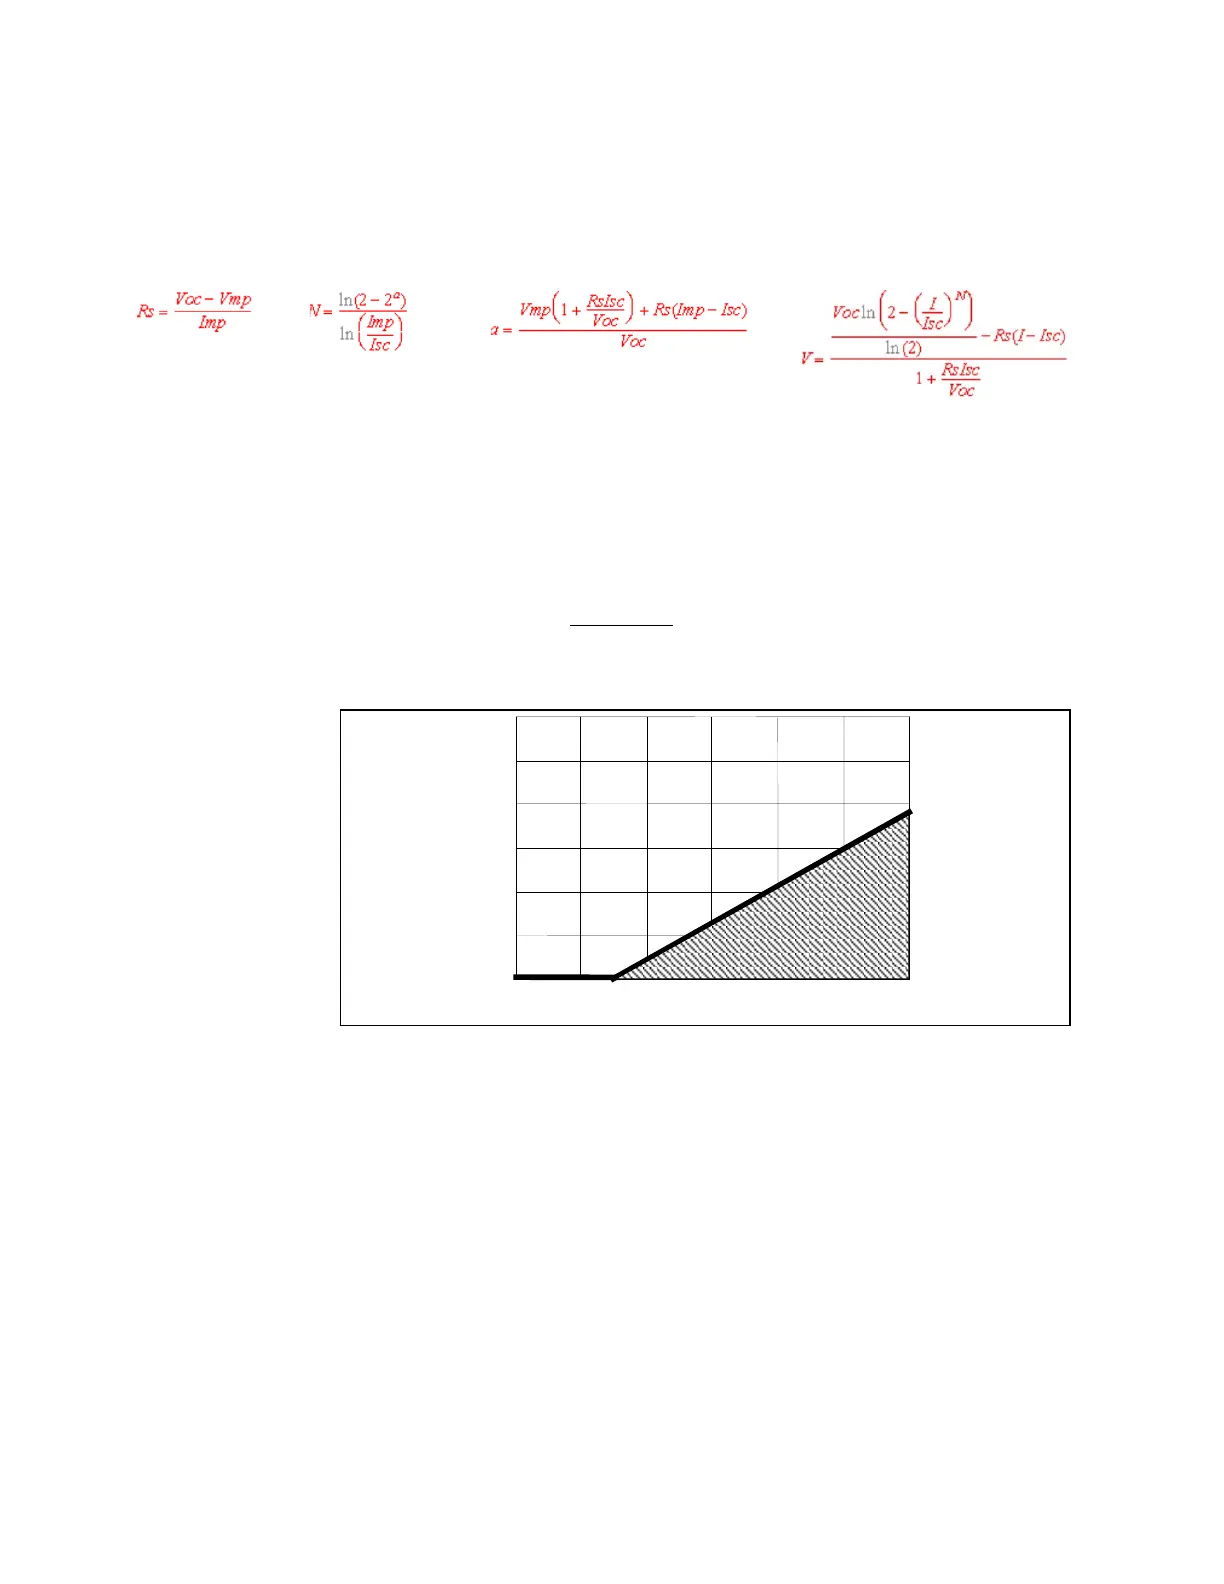
Exponential Model Equations*
The following equations describe the solar array simulator exponential
model using the parameters Rs, N, and a, which are defined as functions
of the four input parameters.
Note that these equations tend to be most accurate for curves that are
somewhat rectangular.** Figure A-2 indicates the potential range of Pmp
error percent due to the modeling equation. The x-axis parameter is
(Voc/Vmp) * (Isc/Imp), which is a measure of the rectangularity of the
simulator curve, with values near 1 being highly rectangular. The y-axis
is a measure of the possible error of the curve algorithm equation at the
peak power point as defined by the following equation:
( )( )
% * %Pmp
Equation
I V
error
Pmp
mp mp
= −
1 100
Figure A-2. Range of Pmp Error Due to Modeling Equation
*The exponential model is described in the paper: Britton, Lunscher, and
Tanju, "A 9 KW High-Performance Solar Array Simulator", Proceedings
of the European Space Power Conference, August 1993 (ESA WPP-054,
August 1993).
**The potential error between the equation’s actual peak power and the
expected peak power (Vmp * Imp) will increase as the curves become
less rectangular.
Measure of Rectangularity (Voc/Vmp) * (Isc/Imp)
1 1.1 1.2 1.3 1.4 1.5 1.6