Quick Reference 2
Keysight InfiniiVision 1000 X-Series Oscilloscopes User's Guide 71
Frequency Response Analysis
On G-suffix oscilloscope models (that have a a built-in waveform generator), the
Frequency Response Analysis (FRA) feature controls the built-in waveform
generator to sweep a sine wave across a range of frequencies while measuring the
input to and output from a device under test (DUT). At each frequency, gain (A)
and phase are measured and plotted on a frequency response Bode chart.
When the frequency response analysis completes, you can move a marker across
the chart to see the measured gain and phase values at each frequency point. You
can also adjust the chart's scale and offset settings for the gain and phase plots.
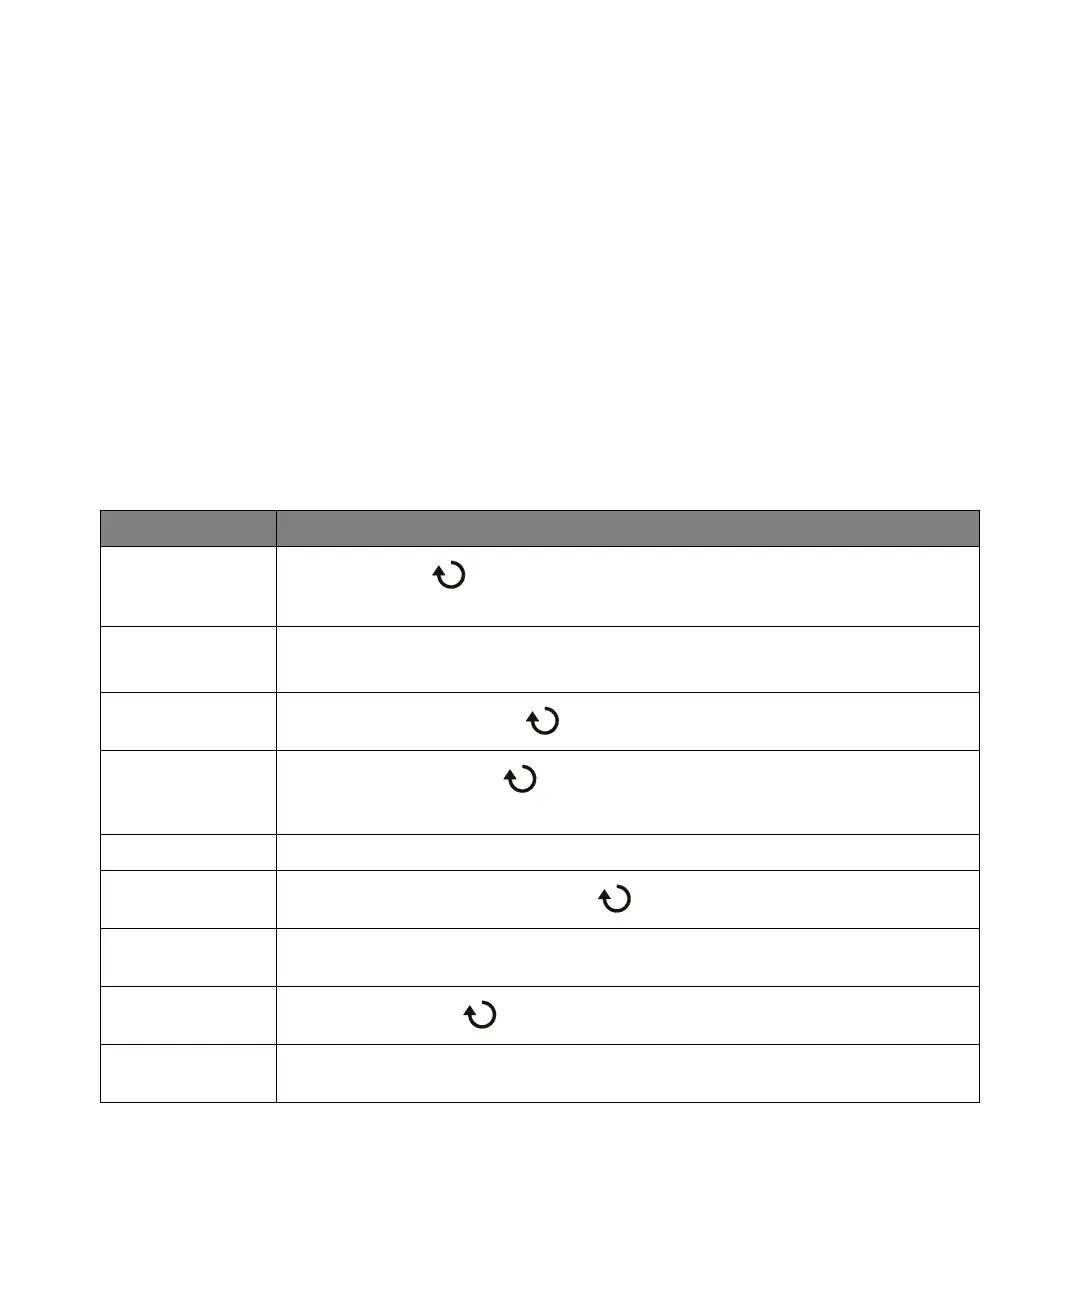
Table 22 Frequency Response Analysis Features
Feature Front Panel Key/Softkey Location (see built-in help for more information)
Frequency Response
Analysis (FRA)
enable/disable
[Analyze] > Features, Entry knob to select Frequency Response Analysis, push Entry knob to
enable or disable
Channels probing DUT
input V and output V
[Analyze] > Setup > Input V
[Analyze] > Setup > Output V
Frequency sweep min
and max values
[Analyze] > Setup > Min/Max Freq, Entry knob
Waveform generator
amplitude and
expected output load
[Analyze] > Setup > Amplitude, Entry knob
[Analyze] > Setup > Output Load (50
Ω, High-Z)
Run the analysis [Analyze] > Run Analysis
Adjust scale and offset
of Bode plots
[Analyze] > Chart > Gain/Phase Scale/Offset, Entry knob
Autoscale gain and
phase plots
[Analyze] > Chart > Autoscale
View measured gain
and phase values
[Analyze] > Move Marker, Entry knob
Save data to USB
storage device
[Save/Recall] > Save > Format, Frequency Response Analysis data (*.csv)
 Loading...