298 Keysight InfiniiVision 3000T X-Series Oscilloscopes User's Guide
18 Frequency Response Analysis
To view and save the analysis results
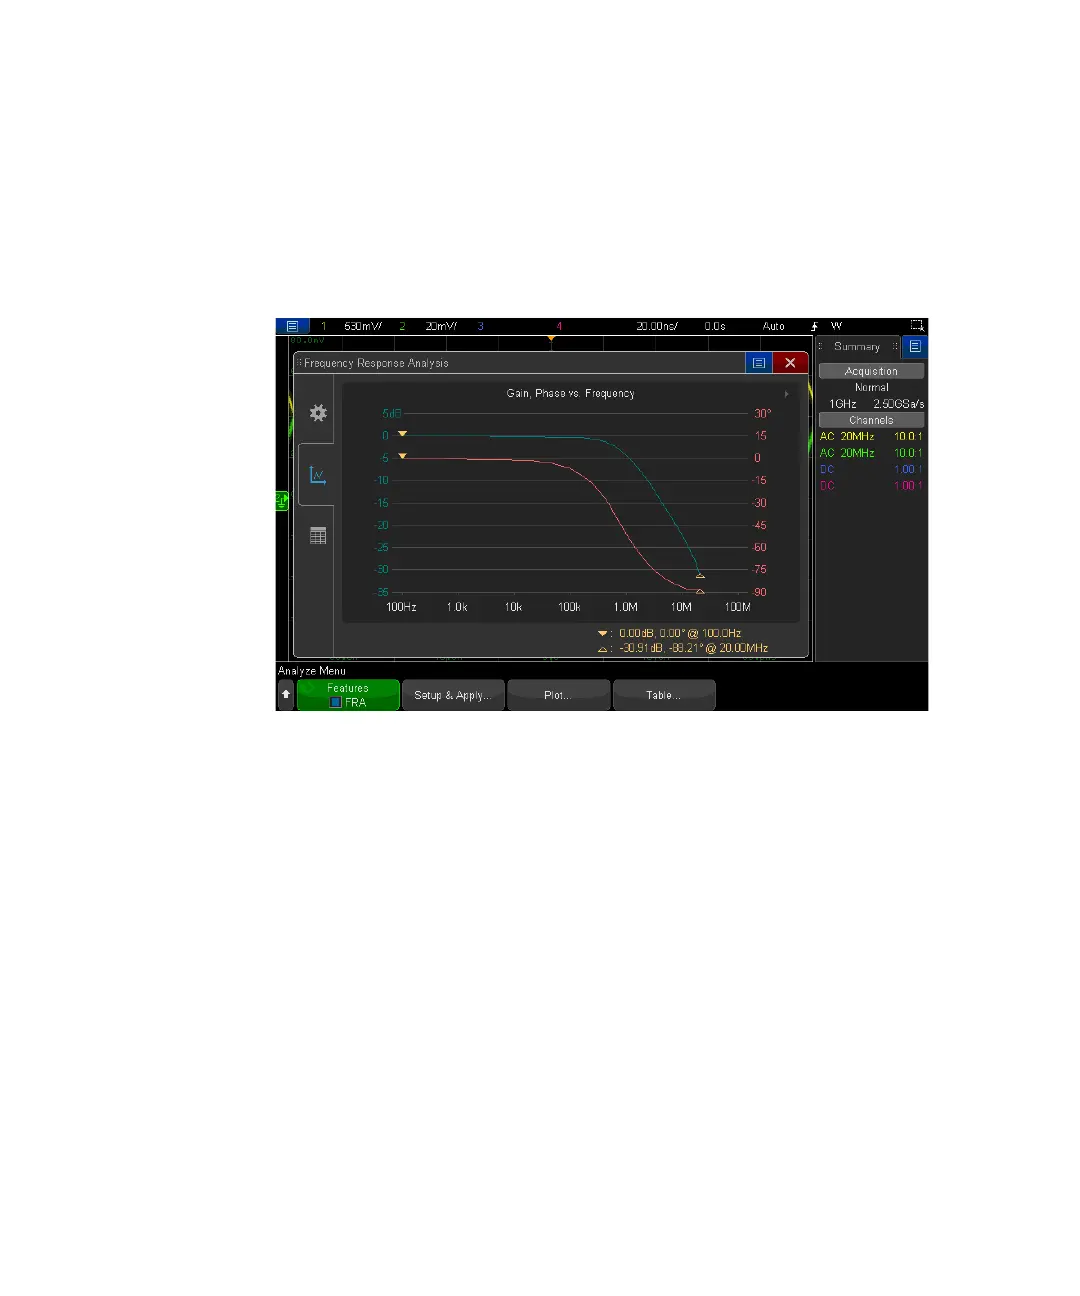
Click the Plot... softkey to open the Frequency Response Analysis dialog box's tab
for viewing the analysis results in a Bode plot.
The plot shows both gain and phase measurements versus frequency. There are
two markers that can be dragged to view actual values along the plot. There is a
control in the upper right corner for adjusting the scale/offset of the plots or
autoscaling.
Click the Table... softkey to open the Frequency Response Analysis dialog box's tab
for viewing the analysis results in table form.