Keysight P937xA PXIe Service Guide 43
Tests, Adjustments, and Troubleshooting
System Verification
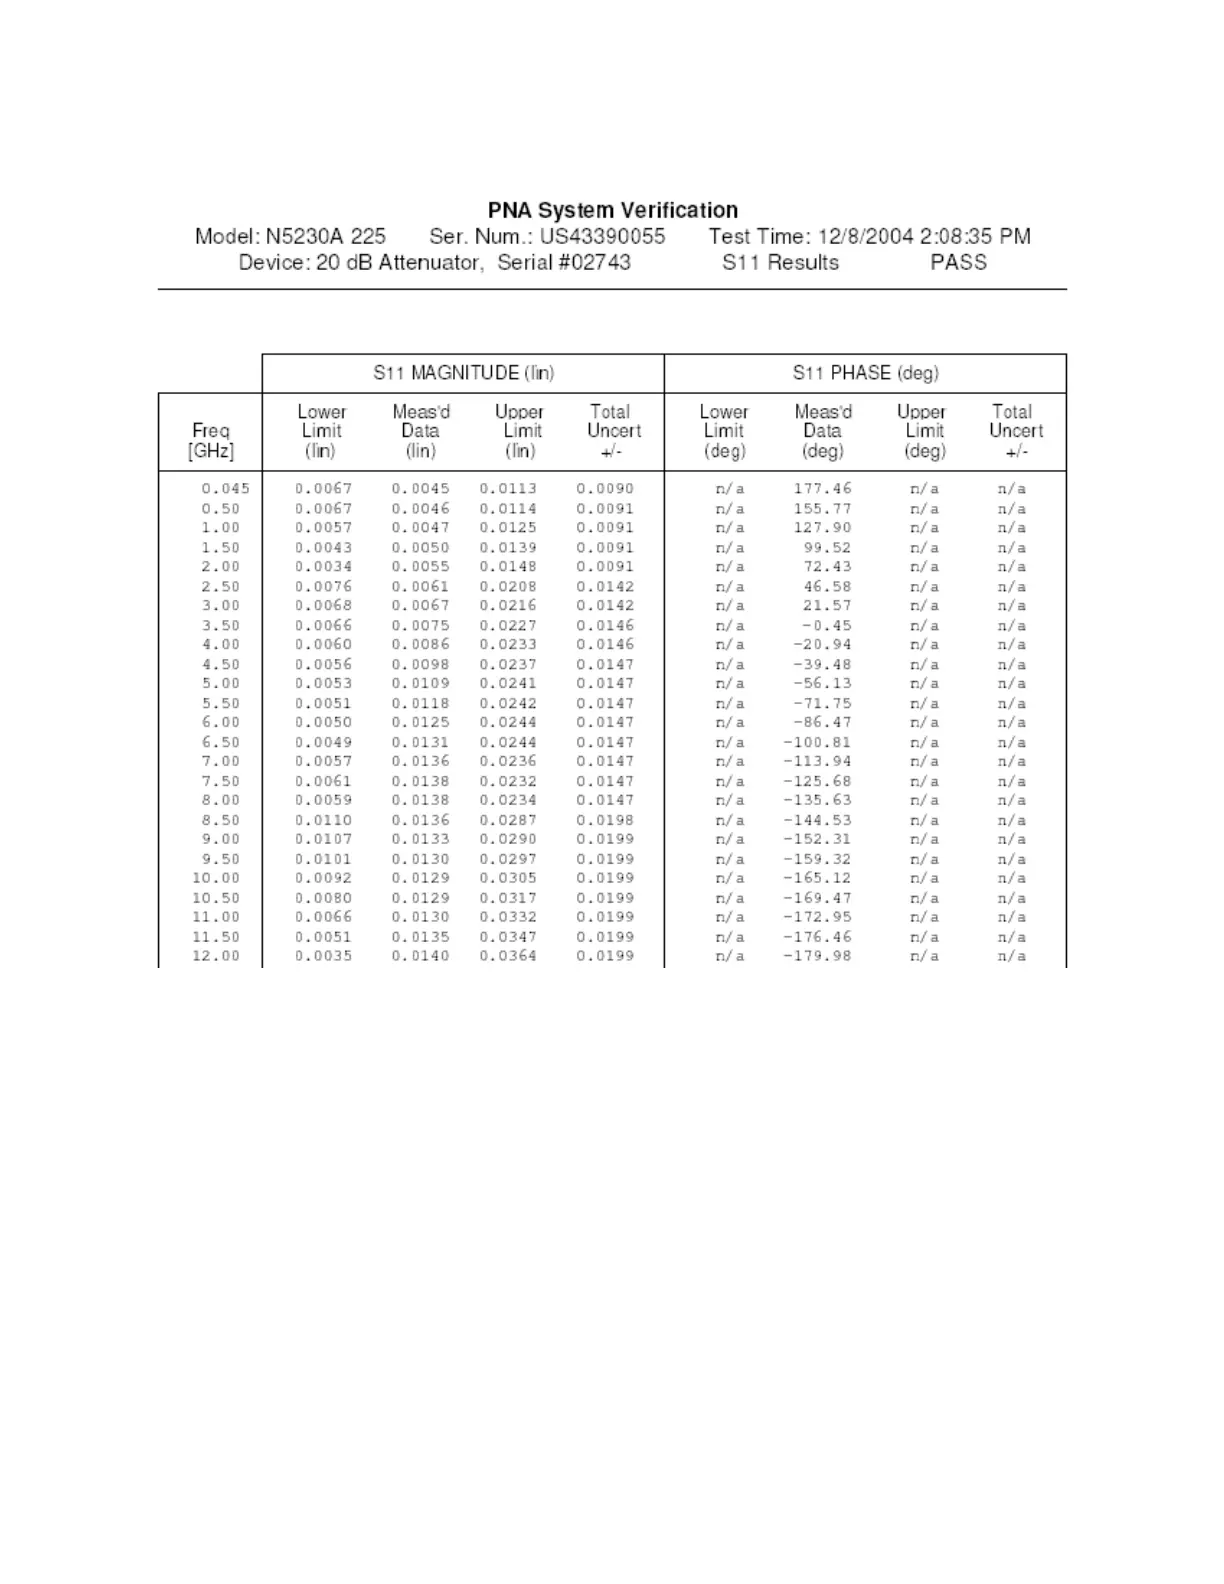
Figure 3-7 Example of Printed Tabular Verification Results
Figure 3-8 shows an example of typical verification results with Print Graphs
selected in the Output area of the System Verification dialog box. The printed
graphical results show the following:
— the name of the device measured
— the serial number of the device
— the parameters measured
— Results of the measurements. Labeled as A in Figure 3-8.
— Data measured at the factory from the verification kit. Labeled as B in Figure
3-8.
— Upper and lower limit points as defined by the total system uncertainty
system. Labeled as C in Figure 3-8.
 Loading...