WAVERUNNER XI SERIES
EXAMPLE 4
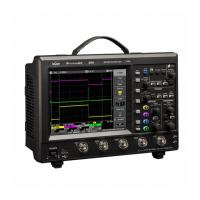
Example 4 is a measurement of DVI (Digital Video Interface) Data-Clock skew jitter measurement, using a
VBScript to emulate the PLL.
In this example, a customer was not able to probe the desired clock signal. The only probing point available was
clock was a factor of 10 slower than the clock embedded in
the data signal (C3). By using a VBScript to create a clock waveform of the appropriate frequency (waveform F1),
the customer was able to display and measure data-clock skew using a LeCroy instrument function and
parameter.
E
XAMPLE 5
the output differential clock signal (C2). However, that
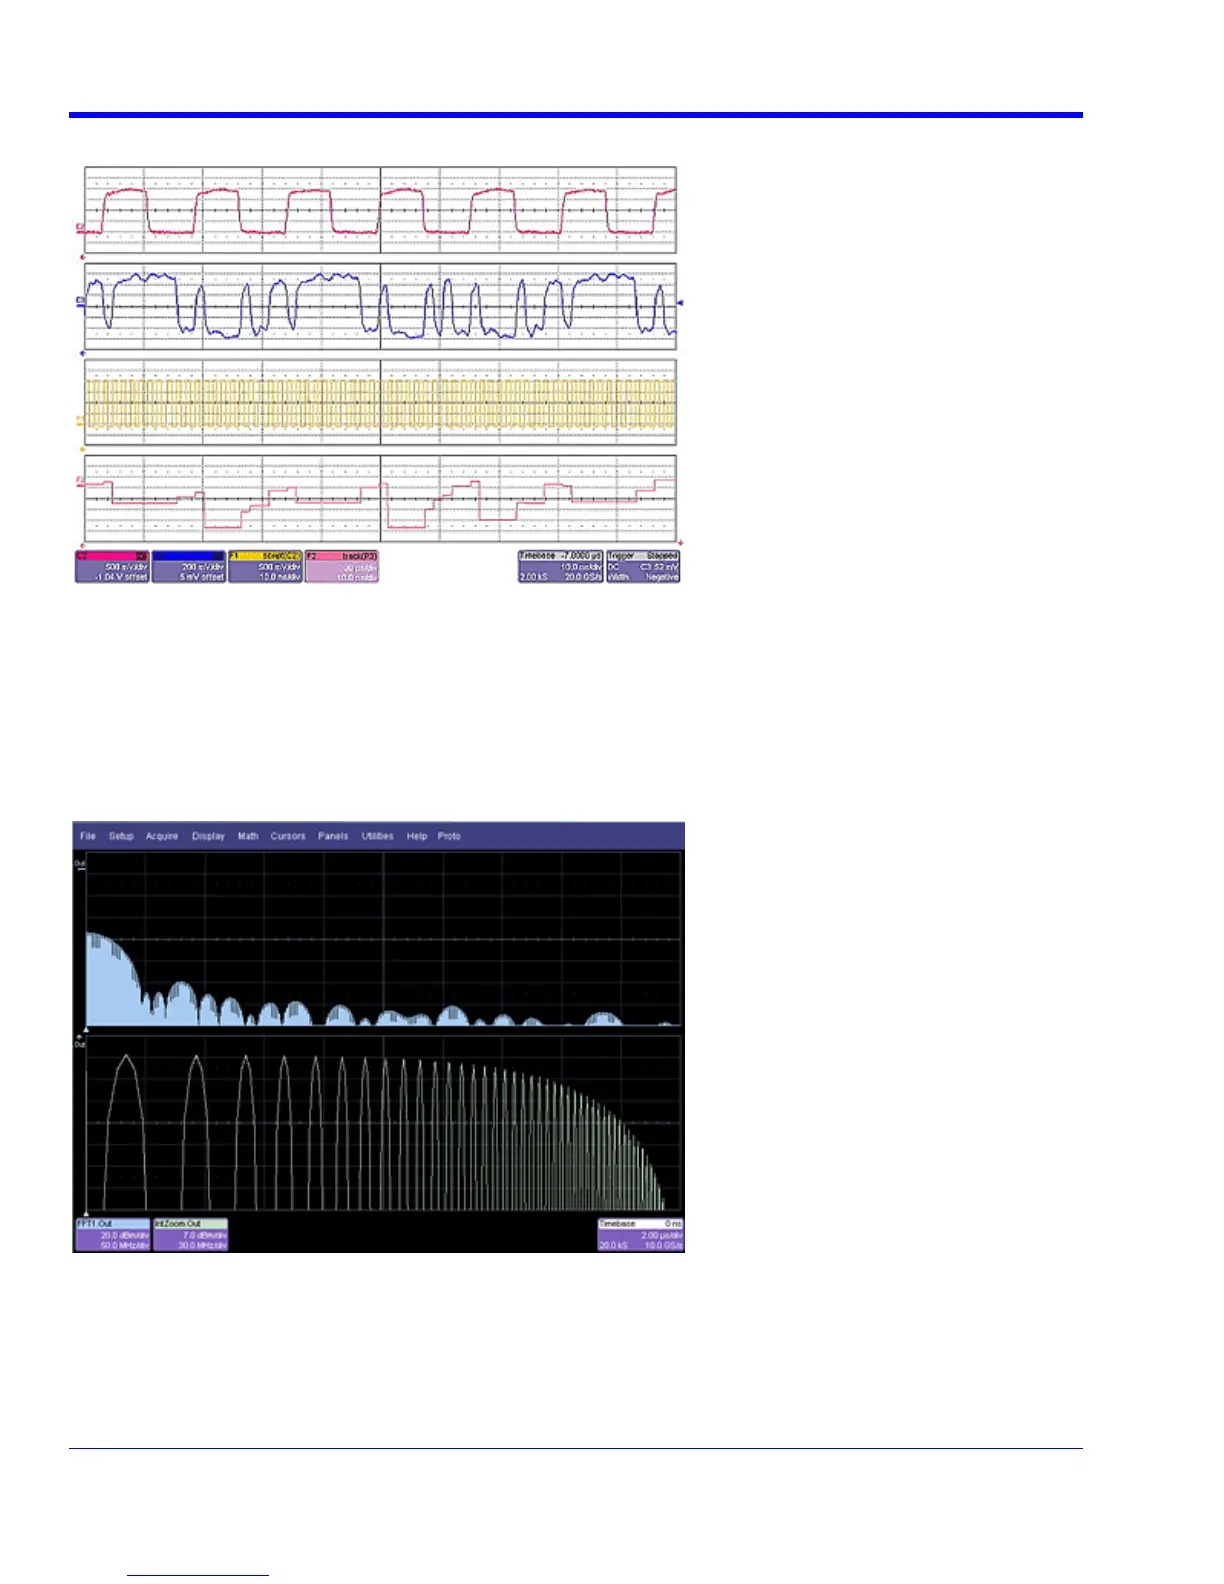
Next is a logarithmic vertical scale, for which the script can be found here. (Most scripts would be far simpler than
this one.)
Frequency response curves are frequently drawn on a logarithmic scale. The upper trace is a frequency sp
of a square wave after enhanced resolution has been applied. It was created using instrum
ectrum
ent functions. The
lower trace is the first lobe of the FFT display. But with a logarithmic frequency scale. Click here for the VBScript.
170 WRXi-OM-E Rev C

 Loading...