-107- v2.9
Sensors
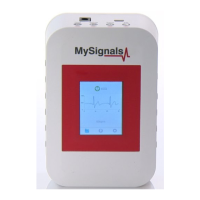
Finally, you can go to detail mode for each sensor selected. Press in the logo of the sensor in General Mode if you
want to see the graphical and numeric values of a specic sensor.
Figure: Detail mode
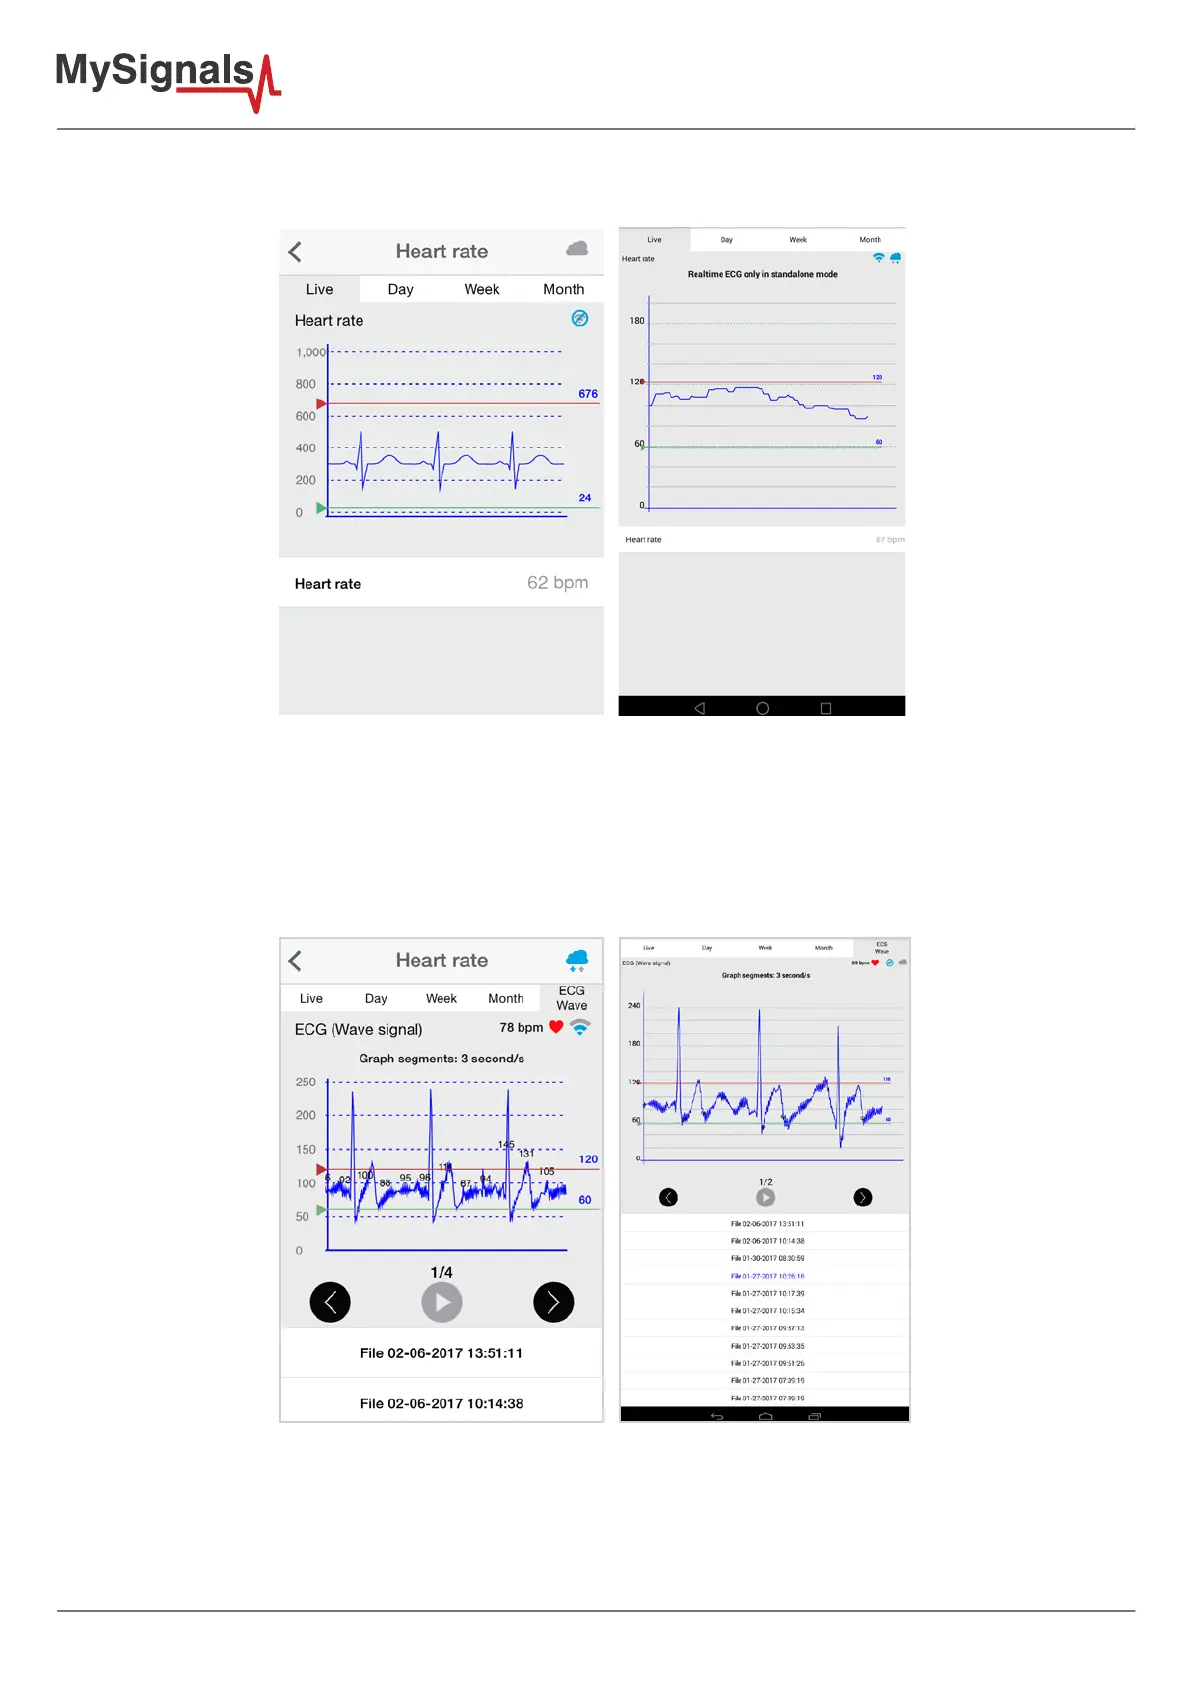
There is a new tab on detail screen for ECG, EMG, Airow and Snore sensors. This tab allows the user to display
raw data recorded from MySignals device (in Server Mode). You can record until 30 seconds from MySignals
device and show the recorded data on raw data tab, this tab is placed on the top right of the screen.
On top right, you can see the ECG rate, EMG rate, Airow rate or Snore rate. Above the graph, you can see the
graph time for X axis, in this case the graph was divided in windows of parts of 3 seconds each.
Over the graph you can notice the values for each important data peak, you can track wave changes by watching
these values.
You can move the limits of the graph with the green and red lines, touch each line to move it along the graph view.
 Loading...