-72- v2.9
Data Access
6.3.2. Sensor detail interface
6.3.2.1. General view
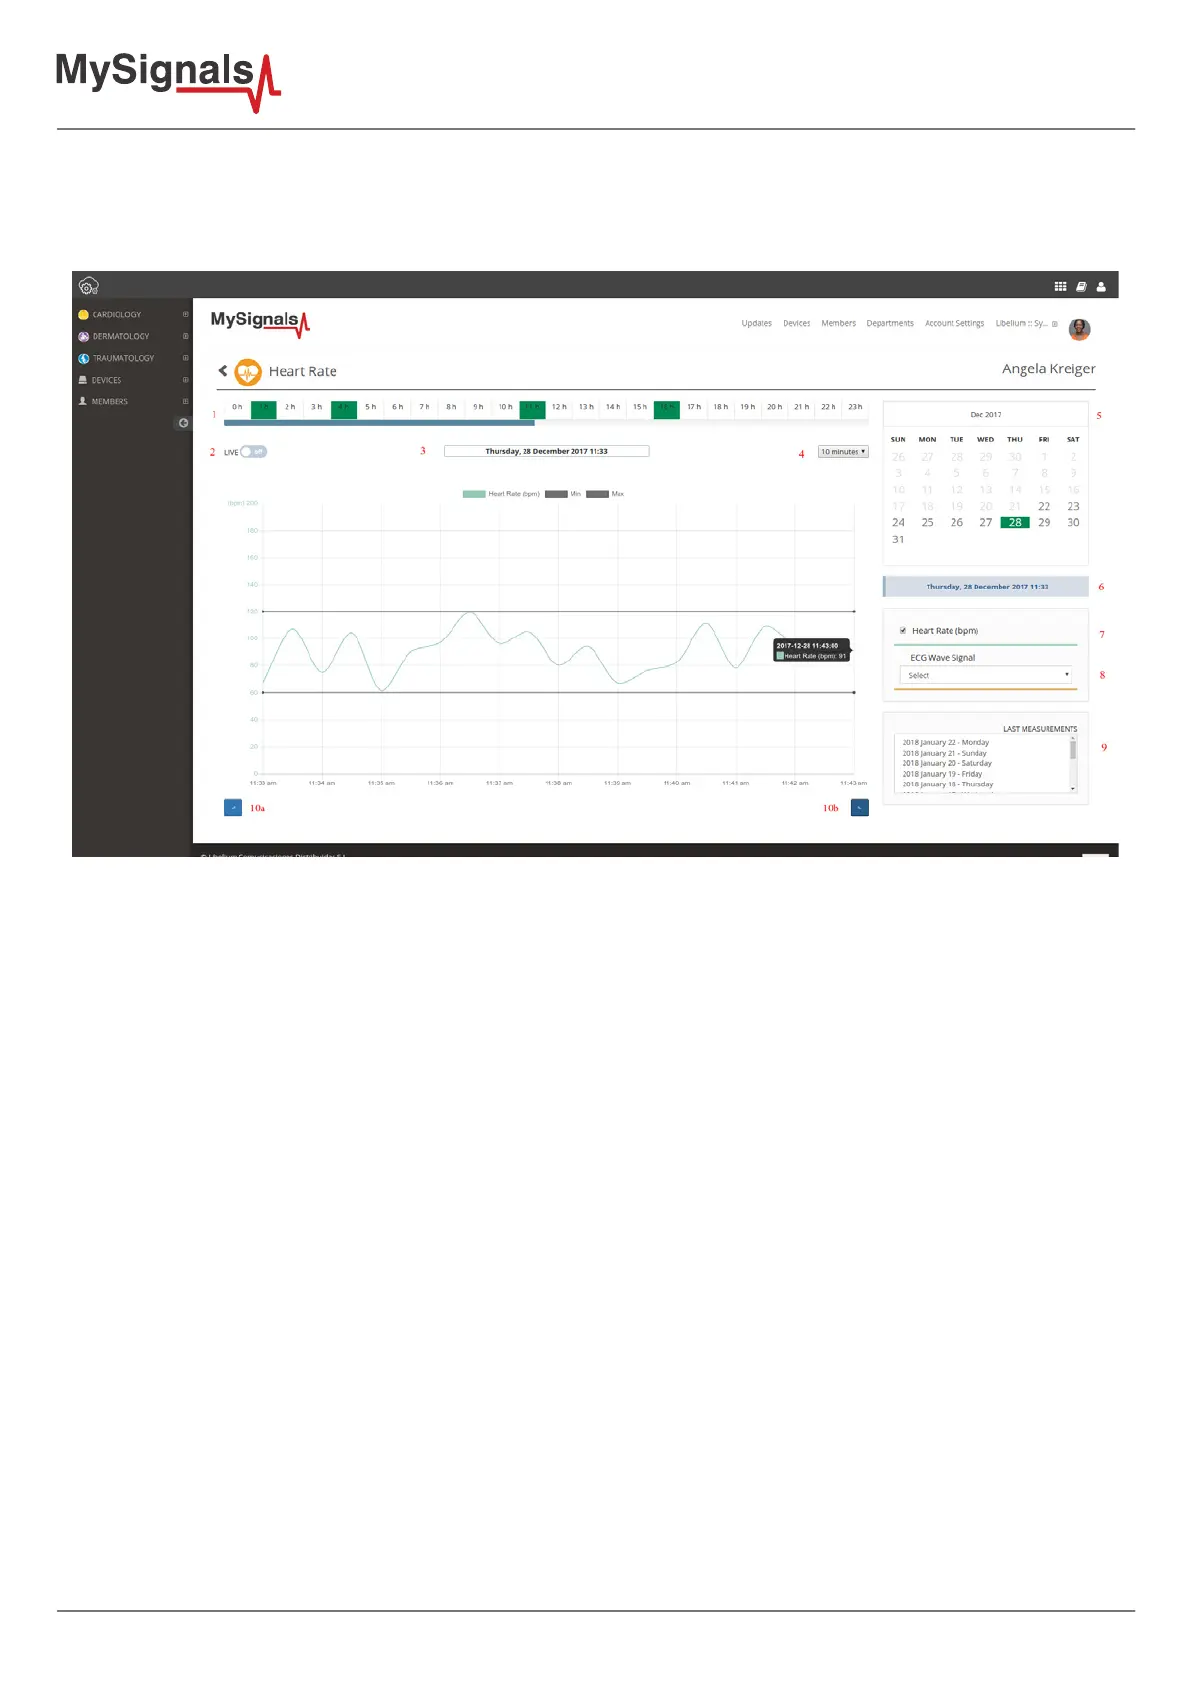
The interface for viewing the stored measurements has the following elements.
1. Hour navigation: Shows the hours of the selected day. Green slots contain data and can be clicked to display
its chart.
2. Live button: Switches between live an historical navigation mode. In live mode the chart is refreshed to represent
the new data arrived to the server.
3. Datetime: Displays the date and time for the data that we are viewing.
4. Window size: Represents the size of the chart window in minutes. It works like a zoom tool.
5. Calendar navigation: Represents the days with available data stored in the server.
6. Datetime: Displays the date and time for the data that we are viewing.
7. Sensor compenents selector: Use this checkboxes to indicate the sensor components that you want to draw in
the chart.
8. Wave Signal selector: Sensors that generate wave signals (EMG, ECG, Air Flow, Snore) displays here a list with all
the stored signals. When an item is selected the signal is drawn.
9. Last measurements: Is a selector with the latest days with available data. If you recorded some data months ago
this can be a quick way to nd them. Note: Wave signals are not displayed here but in the 'Wave Signals selector''
as described in the previous point.
10. Previous and Next buttons: Is jumps to the previousor next stored measurement.